A collection of Nomad jobspecs and Grafana dashboards to provide complete monitoring of Nomad clusters.
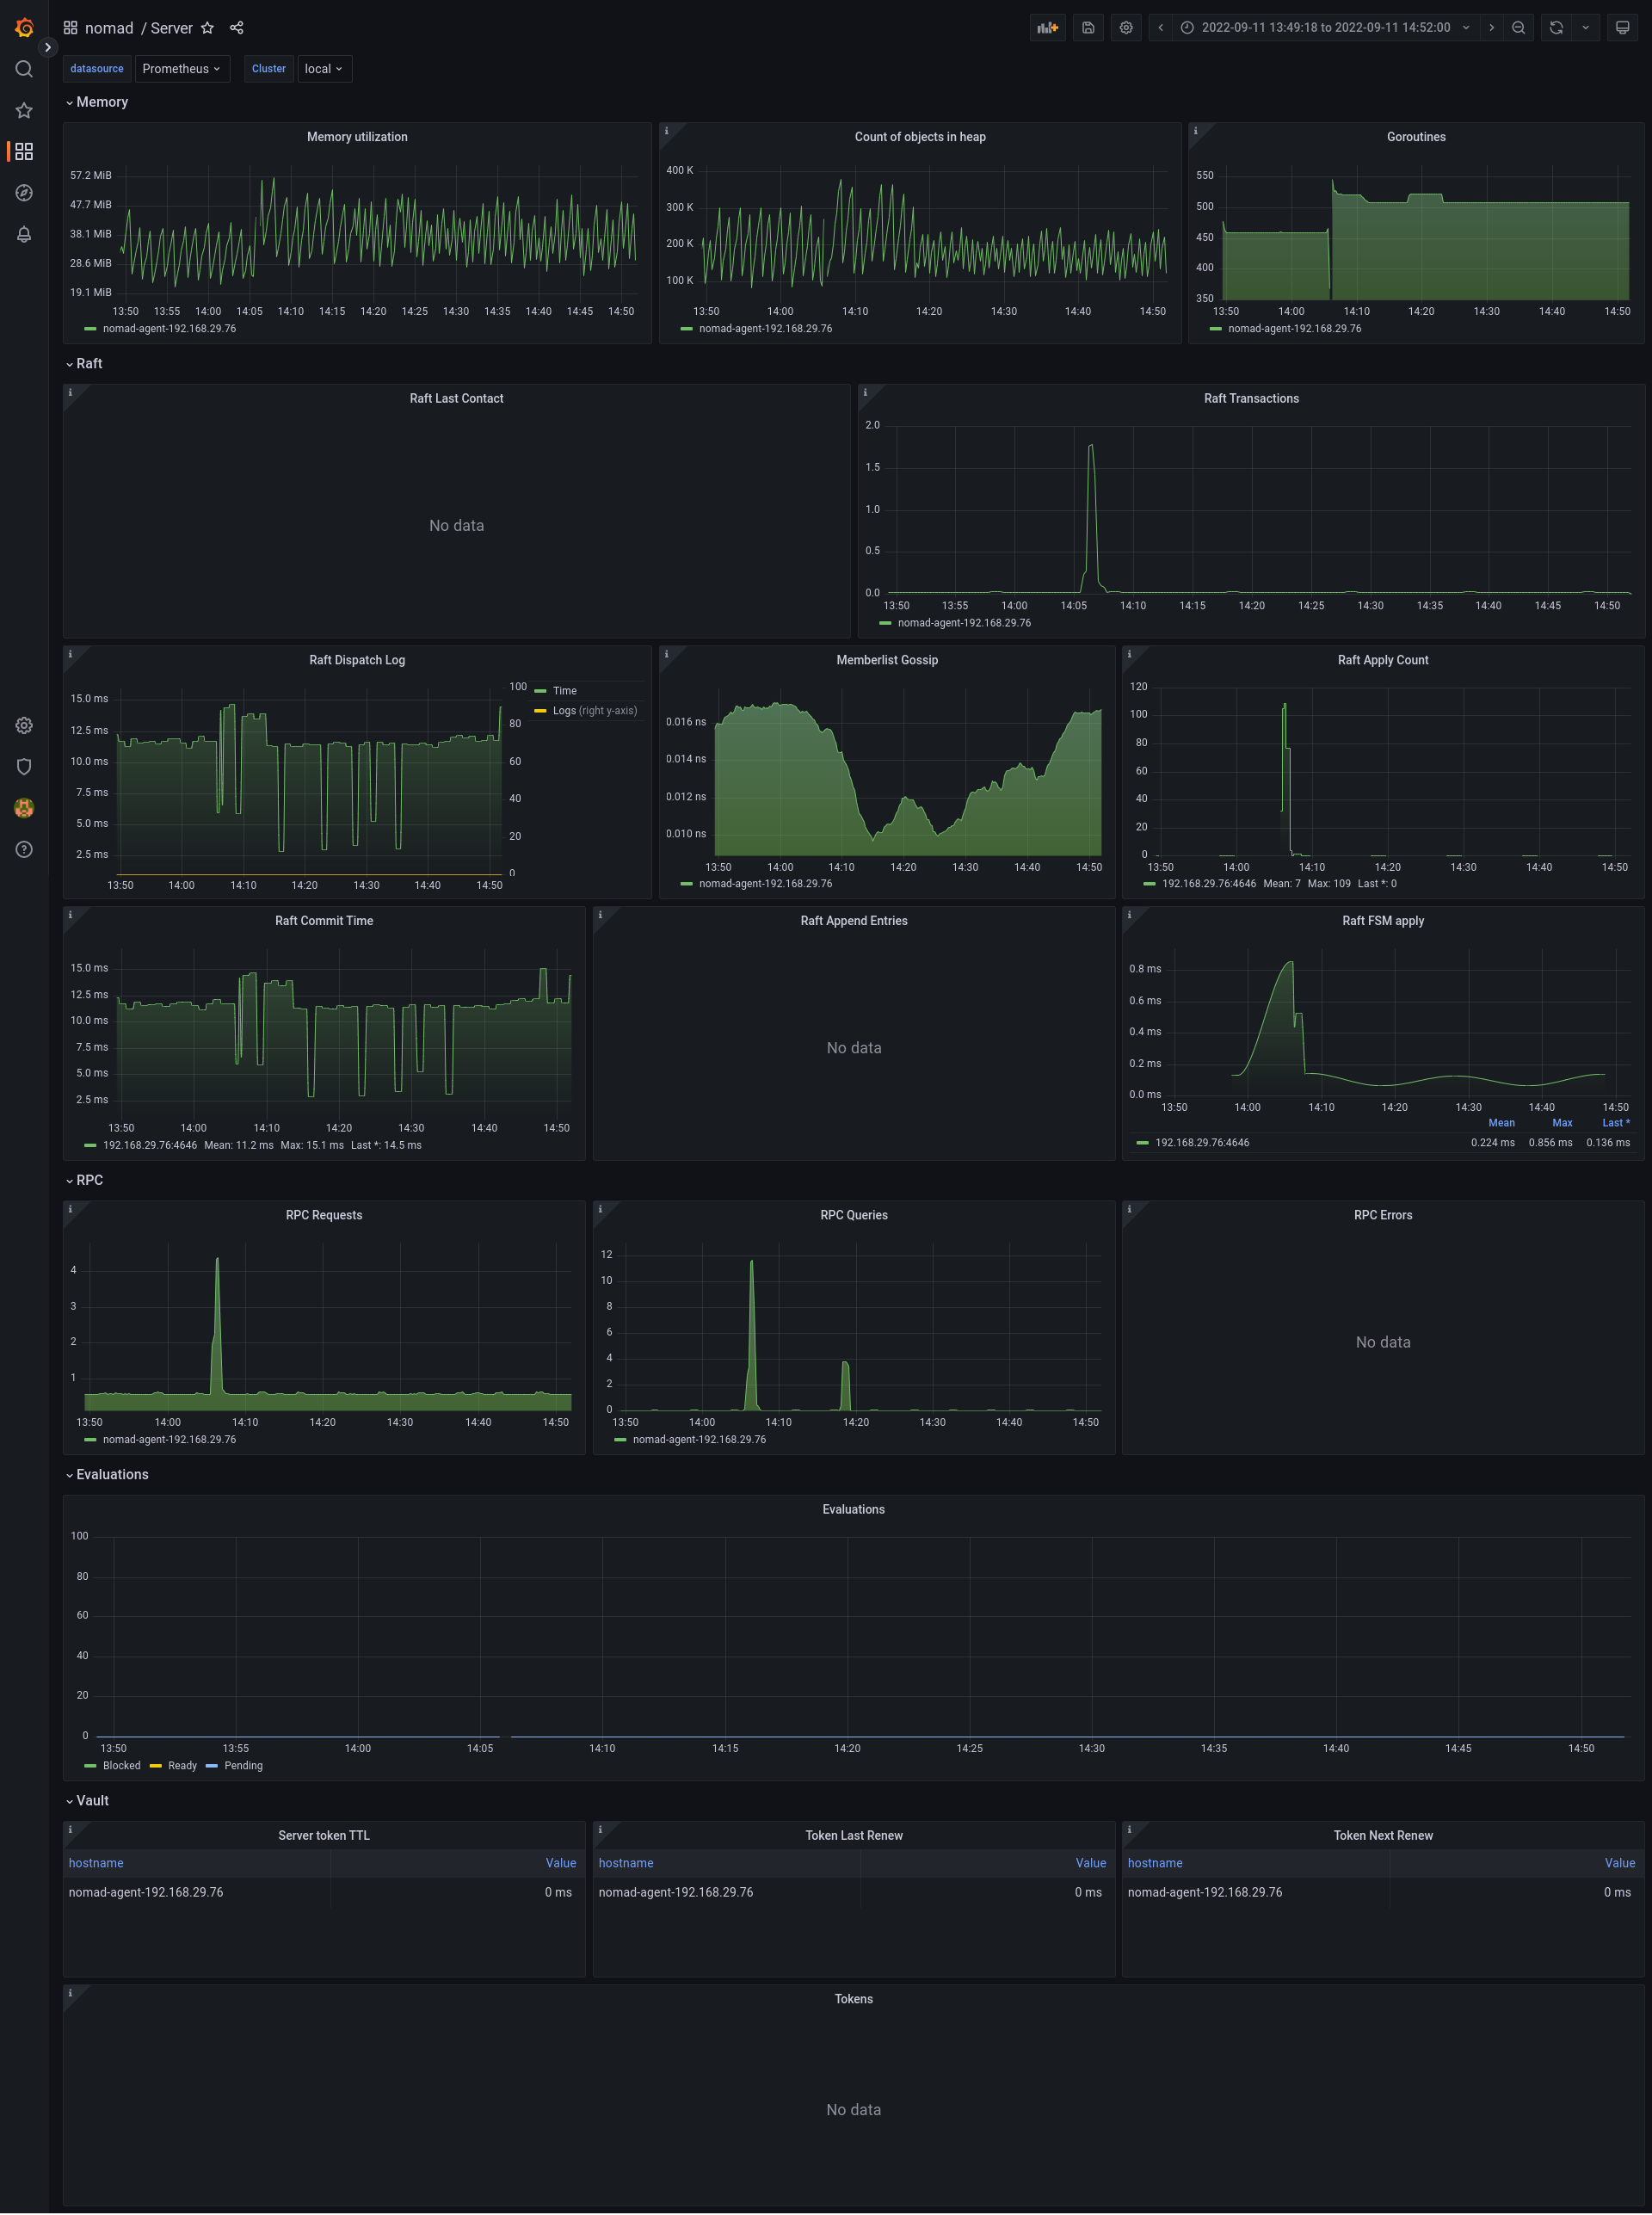
- Server: Monitor overall health and resource usage of a Nomad cluster, Raft usage, RPC usage etc.
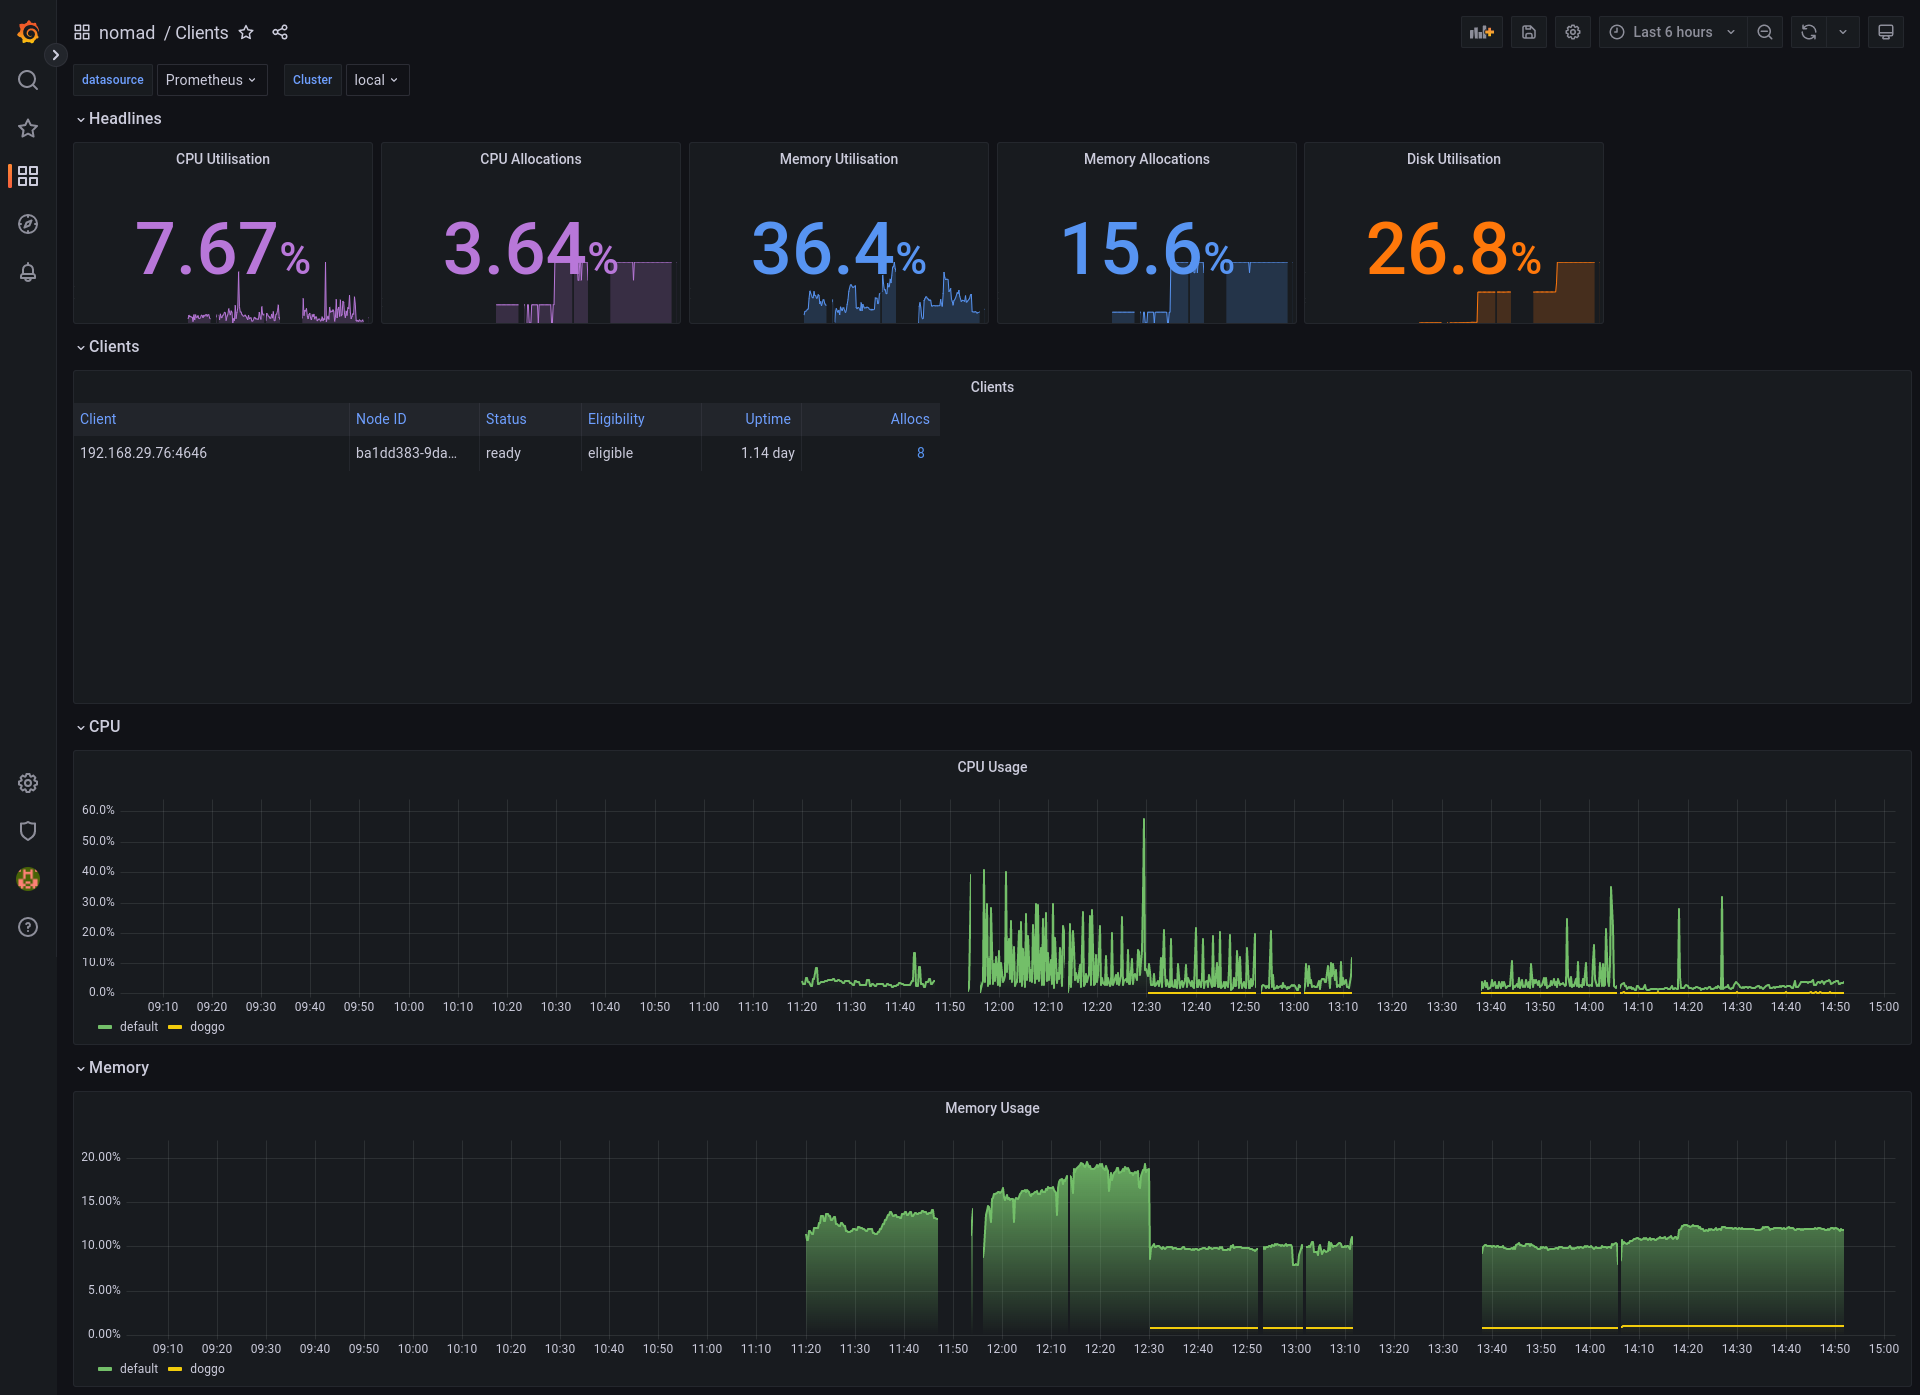
- Client: Monitor resource usage of Nomad clients.
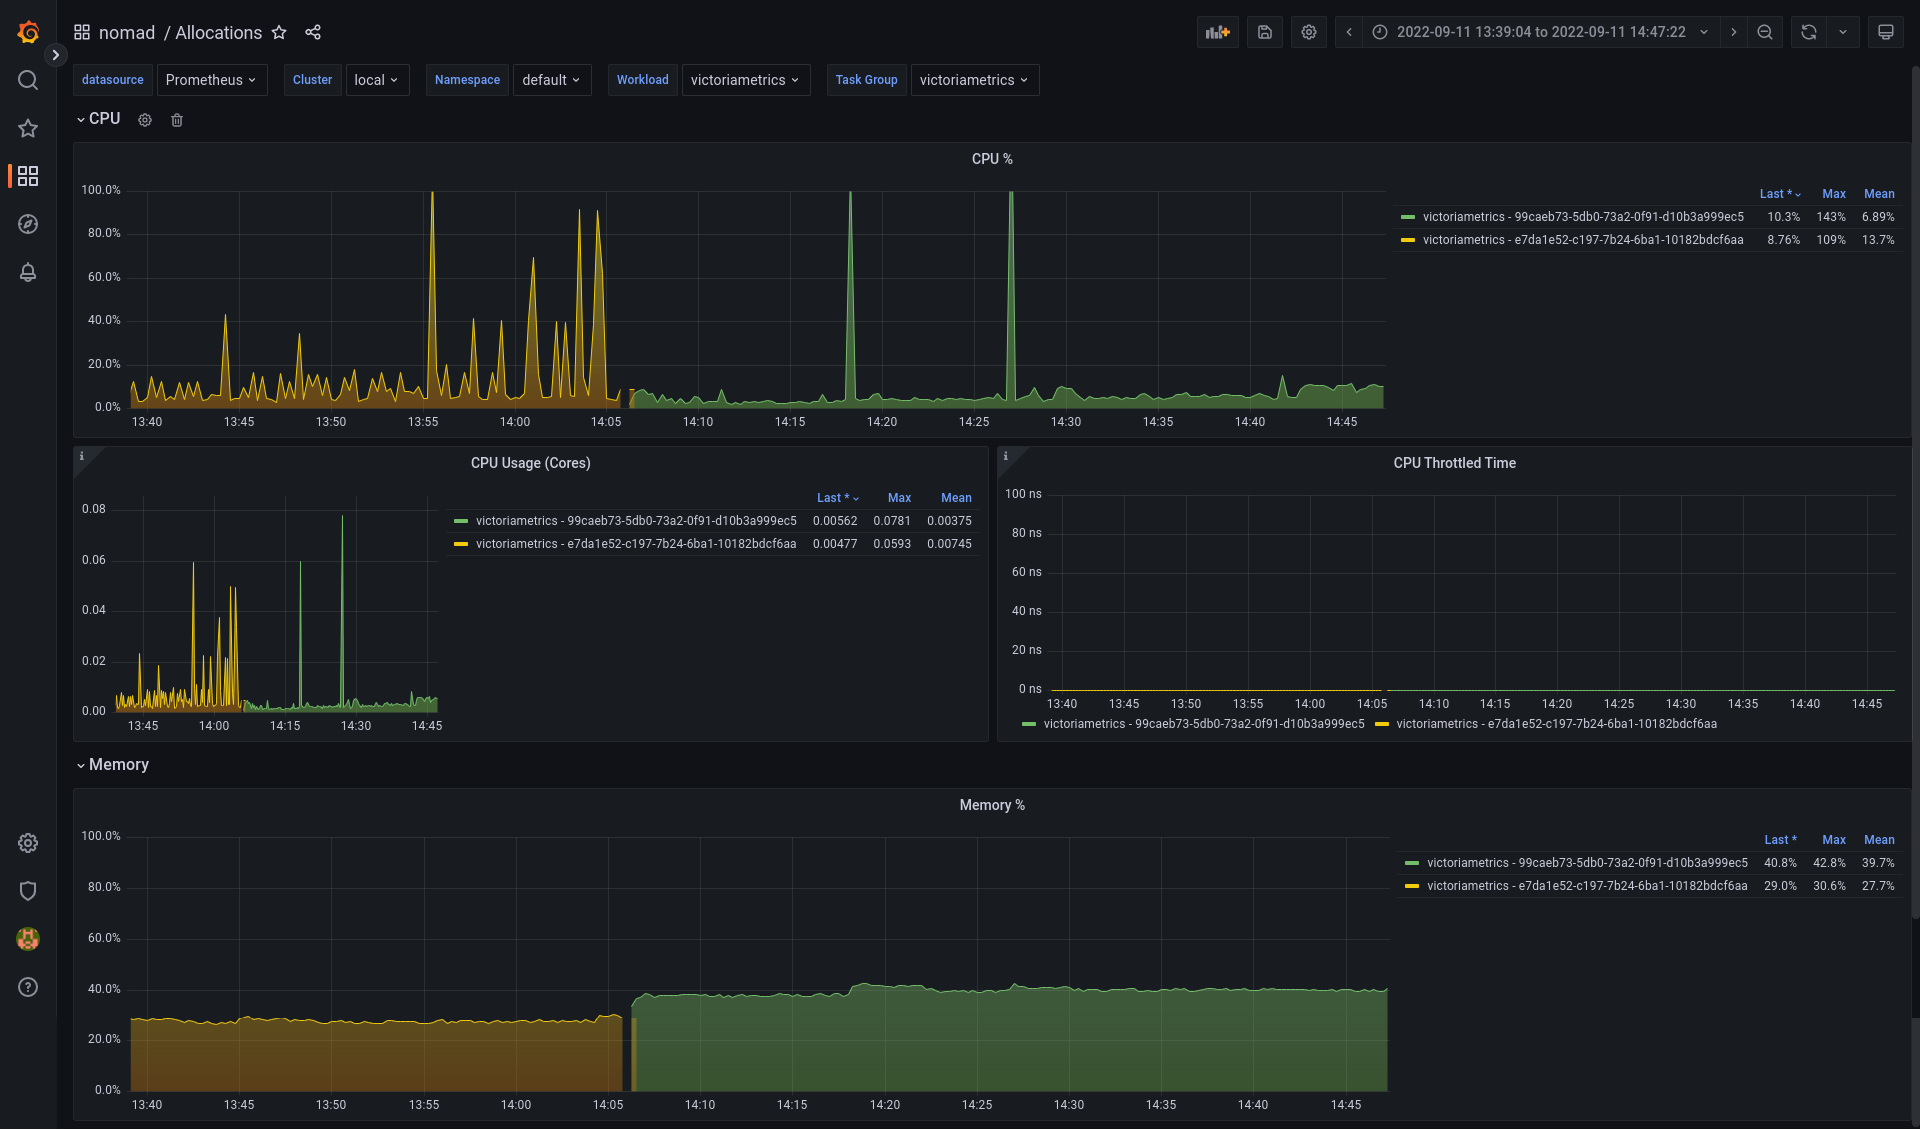
- Allocations: Monitor resource metrics like CPU, Memory and Disk for each allocation across namespaces.
Nomad comes with an in-built publication of metrics, which makes it easier to collect metrics without running any 3-rd party tool. To enable Prometheus metrics, configure the telemetry stanza in each Nomad agent:
telemetry {
  collection_interval        = "15s"
  disable_hostname           = true
  prometheus_metrics         = true
  publish_allocation_metrics = true
  publish_node_metrics       = true
}
This repository demonstrates the usage of vmagent, which is a lightweight metrics collection agent. Prometheus also ships with an agent-only mode, which can be used alternatively. I find vmagent to have a better UX for config (more straightforward relabelling rules, splitting of scrape_configs as multiple files). Its lightweight resource usage makes it my de-facto choice for collecting Prometheus metrics.
Victoriametrics is used as a TSDB to store metrics. Victoriametrics can support large number of active time series in memory and is efficient at storing large batches of time series on disk. vmagent is configured to use remote_write protocol and send the metrics collected to Victoriametrics. The retention period can be configured on Victoriametrics' end.
Since Nomad 1.3, nomad comes with its own service discovery mechanism. It allows for service discovery within the namespaces by templating a file. However, as of now, it cannot discover services outside a particular namespace, making it hard to deploy a central vmagent. Until Nomad services come with that feature, the two choices that exist right now:
- Use
consulfor service discovery and useconsul_sd_configinvmagentto discover. - Deploy
vmagentfor each namespace and discover services via Nomad service discovery. Use them withstatic_config.
To run a local Nomad agent (running as a server and client), run the following:
make run-nomadTo deploy Grafana, Victoriametrics and vmagent, run:
make deploy- Add alert rules


