This is not a production ready prometheus/grafana stack! This is intended for local testing only!
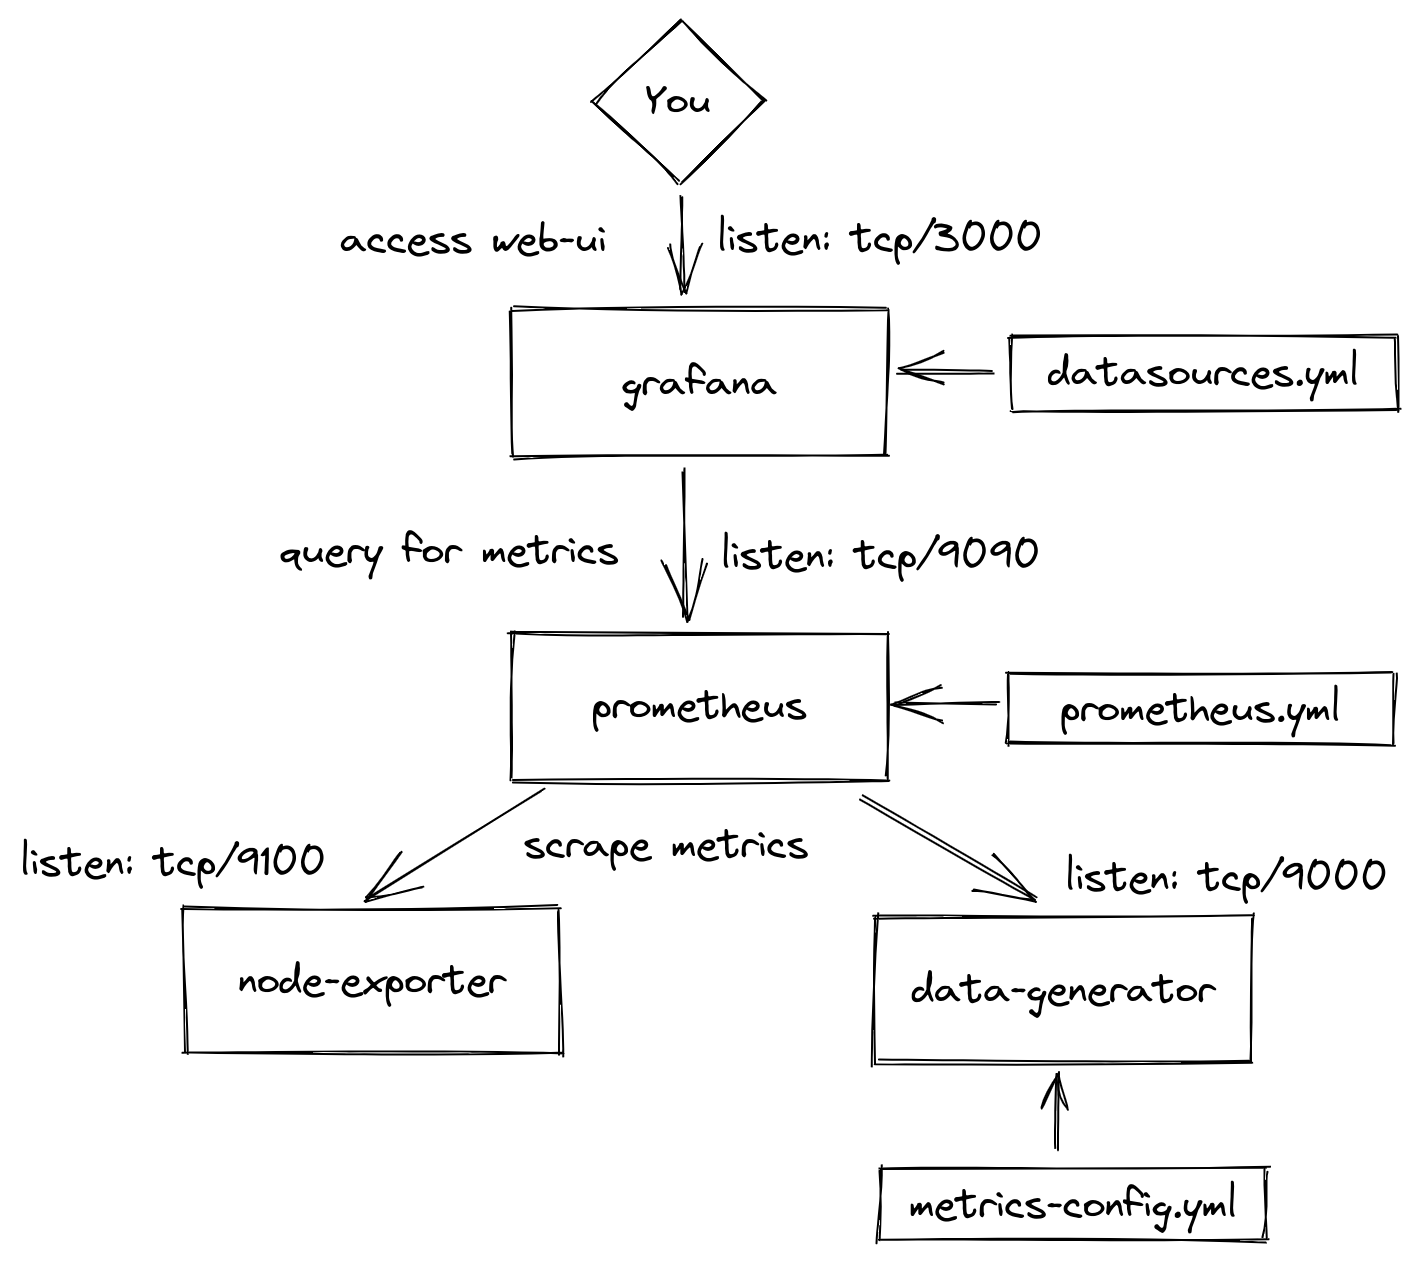
This small repo spins up a local Prometheus and Grafana stack as well as a metrics generator to play around with grafana dashboards using somewhat realistic data.
Projects used:
- podman or docker
- podman-compose or the docker equivalent
This README assumes you are using
podman-compose. If you're ondocker, you should be able to just substitutepodman-composewithdocker-compose. But i did not test it with docker-compose.
- Start the stack by running:
podman-compose up --force-recreate - Then, access the grafana UI at localhost:3000
- Use
admin:adminas the credentials
You can customize the metrics generated by the prometheus-data-generator by editing metrics-config.yml:
---
config:
  - name: oauth_server_requests_total
    description: oauth requests
    type: counter
    labels:
      - container
      - code
    sequence:
      - eval_time: 1
        values: 1-50
        operation: inc
        labels:
          container: oauth-server
          code: 500
      - eval_time: 1
        values: 2000-5000
        operation: inc
        labels:
          container: oauth-server
          code: 200
See github.com/little-angry-clouds/prometheus-data-generator for a complete documentation on config.
After changing the file, you will need to trigger a config reload. You can either restart and recreate the whole stack or visit localhost:9000/-/reload in your browser to trigger a reload of the generator.
Alternatively, issue an HTTP-Get request on the command line using curl:
curl http://localhost:9000/-/reload
The stack now supports running the prometheus unit tests. Make sure test.yml contains your prometheus unit test definitions, then run:
make tests
to run the unit tests.
Here is a birds eye view of the docker-compose stack that is set up:
