- Write a simple bash script that deploys a kind cluster locally
- Download the kubeconfig for the cluster and store in a safe place, we will use it much later in the next steps
- When kind is up and running, dockerize a simple hello world express and deploy to dockerhub
- create a kubernetes deployment manifest to deploy to deploy the Node.js to the kind cluste but don't apply it yet
- using the kubectl terraform provider, write a terraform code to deploy the kubectl manifest to the kind cluster
- Using the kube-prometheus stack, using terraform helm provider, setup monitoring and observability for the prometheus cluster.
-
Linux Environment: You need a Linux/Unix environment to run the commands mentioned in this guide. You can use WSL or a virtual machine if you're on Windows.
-
Docker: Make sure Docker is installed on your machine as it is required to run Kubernetes in Docker (kind).
-
kubectl: Install
kubectl, the Kubernetes command-line tool, to interact with your Kubernetes cluster. See the Docs for installation guide. -
Terraform: Install Terraform for infrastructure provisioning. I use tfenv to install and manage Terraform versions.
-
Node.js: Install Node.js if you haven't already. See the Docs for installation guide.
-
DockerHub Account: Create a DockerHub account if you don't have one to push your Docker images.
-
Install
kind# Install kind (Kubernetes in Docker) [ $(uname -m) = x86_64 ] && curl -Lo ./kind https://kind.sigs.k8s.io/dl/v0.20.0/kind-linux-amd64 chmod +x ./kind sudo mv ./kind /usr/local/bin/kind
-
We will create the Kind cluster with a configuration file that will specify appropriate DNS configurations that allows pulling of images. Create a file called
cluster_config.yamland insert the following code:--- kind: Cluster apiVersion: kind.x-k8s.io/v1alpha4 nodes: - role: control-plane extraPortMappings: - containerPort: 53 hostPort: 53 protocol: UDP - containerPort: 53 hostPort: 53 protocol: TCP
-
Create a Bash script to automate the cluster deployment process. The script will also download the kubeconfig for the cluster for use later. Let's call it
ignite_cluster.sh:#!/bin/bash # Create a Kubernetes cluster with kind kind create cluster --config ./cluster_config.yaml --name ignite-cluster # Download kubeconfig mkdir -p ~/.kube kind get kubeconfig --name ignite-cluster > ~/.kube/config
-
Make the script executable:
chmod +x ignite_cluster.sh
-
Run the script:
./ignite_cluster.sh
-
Create a simple
Hello WordNode.js/Express app with the following steps- Create a directory named
ignappandcdinto it - Run
npm init - Install
expressby runningnpm install express - Create a file named
ignapp.jsand insert the following code:
  const express = require('express')
  const app = express()
  const port = 3210

  app.get('/', (req, res) => {
  res.send('Hello World!')
  })

  app.listen(port, () => {
  console.log(`Example app listening on port ${port}`)
  })
- Run
node ignapp.jsand use postman to send a GET request tolocalhost:3210to getHello Worldas a response.
- Create a directory named
-
Now, Dockerize it! Create a
Dockerfilein theignappdirectory and insert the following code:# Use an official Node.js runtime as the base image FROM node:20-alpine # Set the working directory in the container WORKDIR /app # Copy package.json and package-lock.json to the working directory COPY package*.json ./ # Install app dependencies RUN npm install # Copy the rest of the application code to the working directory COPY . . # Expose port 3210 EXPOSE 3210 # Define the command to run the application CMD ["node", "ignapp.js"]
-
Build and push the Docker image:
docker build -t <your-dockerhub-username>/ignapp:1.0 .
docker push <your-dockerhub-username>/ignapp:1.0
-
Create a directory called
ign_deploymentto hold our deployment code. -
Within the
ign_deployment, create a Kubernetes deployment manifest file calledign_k8s_deployment.yamlfor our app. Insert the following code which will pull our image from docker hub and deploy into the cluster:--- apiVersion: apps/v1 kind: Deployment metadata: name: ignapp spec: replicas: 3 selector: matchLabels: app: ignapp template: metadata: labels: app: ignapp spec: containers: - name: ignapp image: dankuta/ignapp:1.0 ports: - containerPort: 3210 --- apiVersion: v1 kind: Service metadata: name: ignapp-service spec: selector: app: ignapp ports: - protocol: TCP port: 3210 targetPort: 3210
Step 5: Deploy the Node.js App to the Kubernetes Cluster using the Deployment Manifest and Terraform
-
Create a Terraform configuration to deploy the Kubernetes manifest created above using the
kubectlTerraform provider. Add the following to yourmain.tf. Your Terraform configuration can be structured thus within theign_deploymentdirectory:ign_deployment/ ├── main.tf └── variables.tf
Remember to add the variable for the kubernetes config path. This is how Terraform would know what cluster to deploy into.
terraform {
required_version = ">= 0.13"

required_providers {
    kubectl = {
    source  = "gavinbunney/kubectl"
    version = ">= 1.7.0"
    }
}
}

provider "kubectl" {
load_config_file = true
config_path      = var.kube_config_path
}

resource "kubectl_manifest" "ignapp" {
yaml_body = file("${path.module}/ign_k8s_deployment.yaml")
}
-
Run
terraform init,terraform plan, andterraform applyto deploy the app intoignite_cluster
Step 6: Using Helm and Terraform, Install Kube-Prometheus in the Cluster for Monitoring and Observability
-
First ensure
Helmis installed. See the Docs to use the installation guide. -
We will use kube-prometheus-stack which will install all the necessary tools we need right now such as
Prometheus,Grafana,AlertManager, andPrometheus Node Exporter. -
To install this using Terraform and Helm, we will add the helm terraform provider to our Terraform configuration:
provider "helm" {
    kubernetes {
        config_path = var.kube_config_path
    }
}
-
Add a new
helm_releaseresource block tomain.tf:resource "helm_release" "kube_prom" { name = "kube-prometheus-stack" chart = "prometheus-community/kube-prometheus-stack" }
-
Before running
terraform init, ensure you have added thekube-prometheus-stackrepository:helm repo add prometheus-community https://prometheus-community.github.io/helm-charts helm repo update
-
Run
terraform init,terraform plan, andterraform applyto deploykube-prometheus-stackintoignite_cluster
-
After the Terraform deployment is successful, you should have kube-prometheus up and running in your Kubernetes cluster.
-
To access the monitoring stack, you can use port forwarding to access the Grafana dashboard, Prometheus, and other components. Run each of these commands in a new terminal tab:
kubectl port-forward deployment/kube-prometheus-stack-grafana 3220:3000
kubectl port-forward deployment/kube-prometheus-stack-prometheus 9090:9090
-
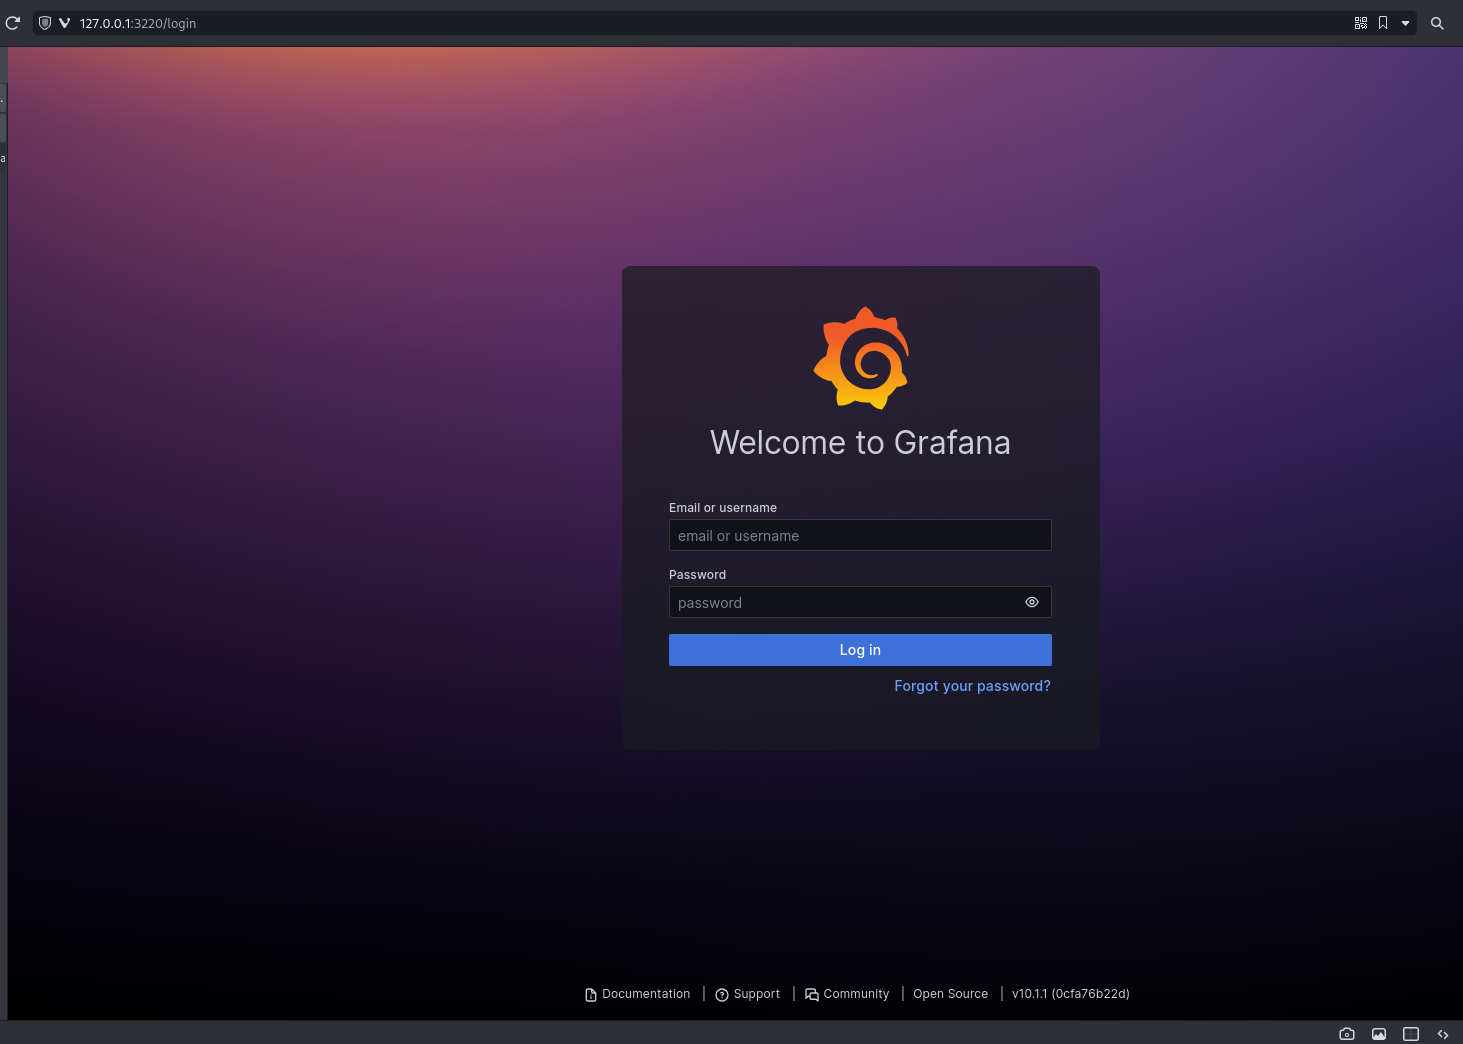
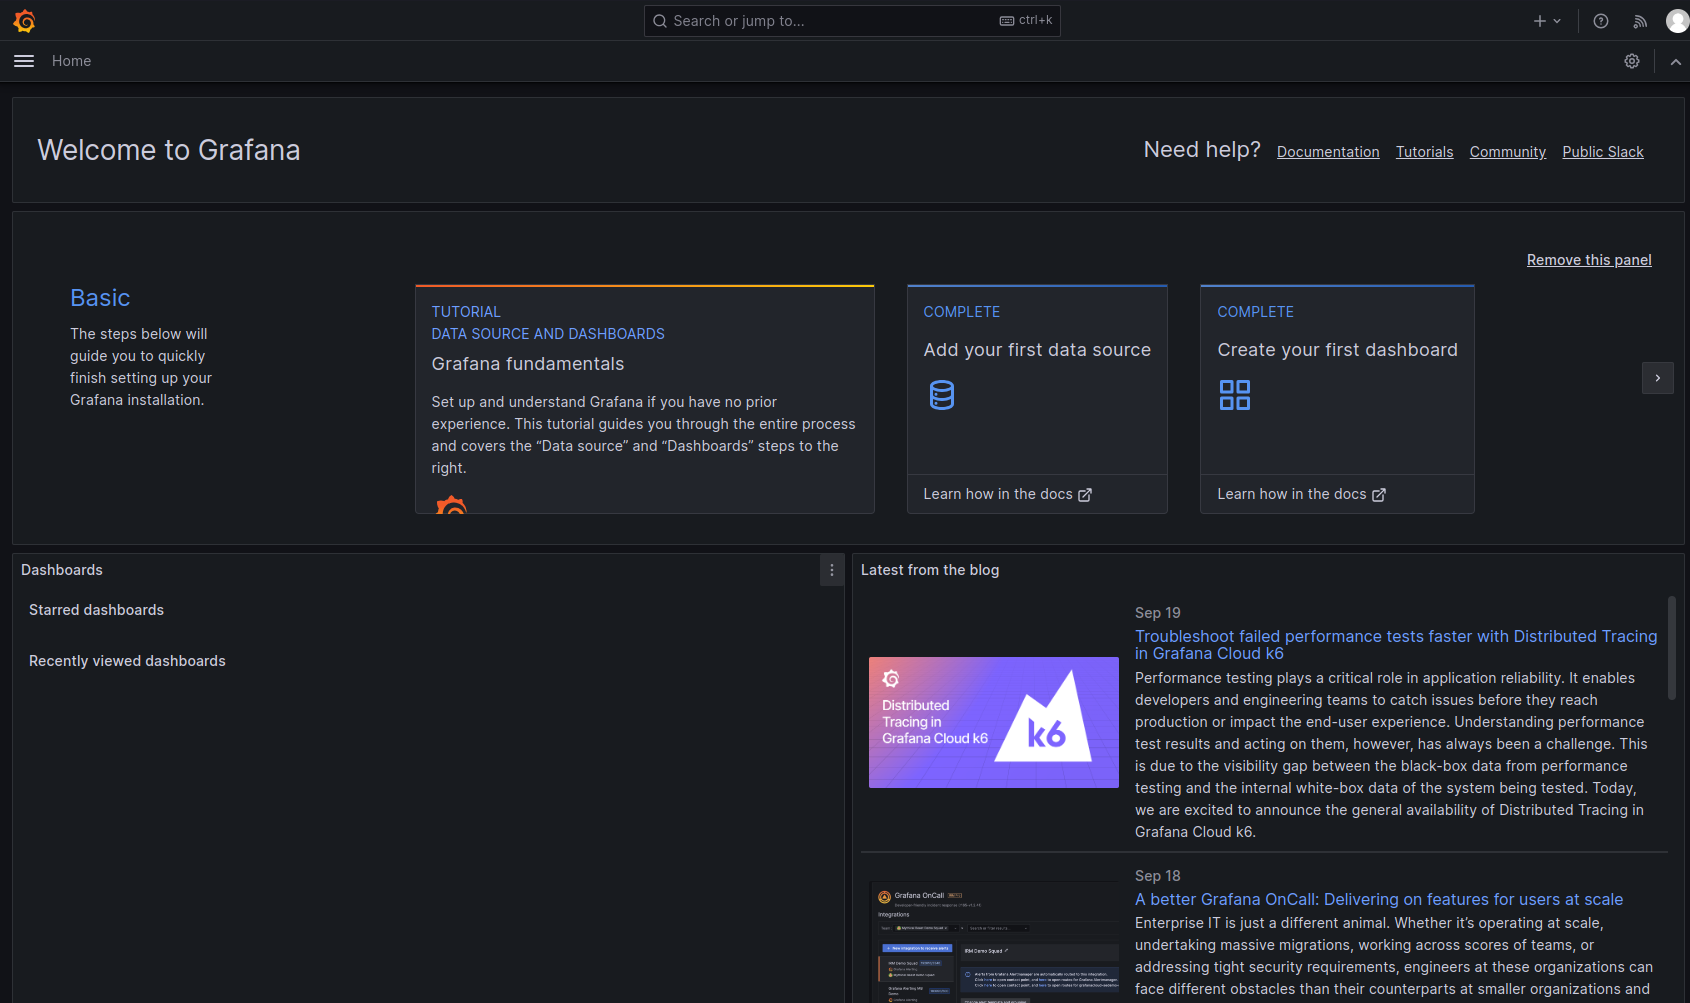
Access Grafana in your web browser at http://localhost:3220. Default username is
adminand default password isprom-operator.

-
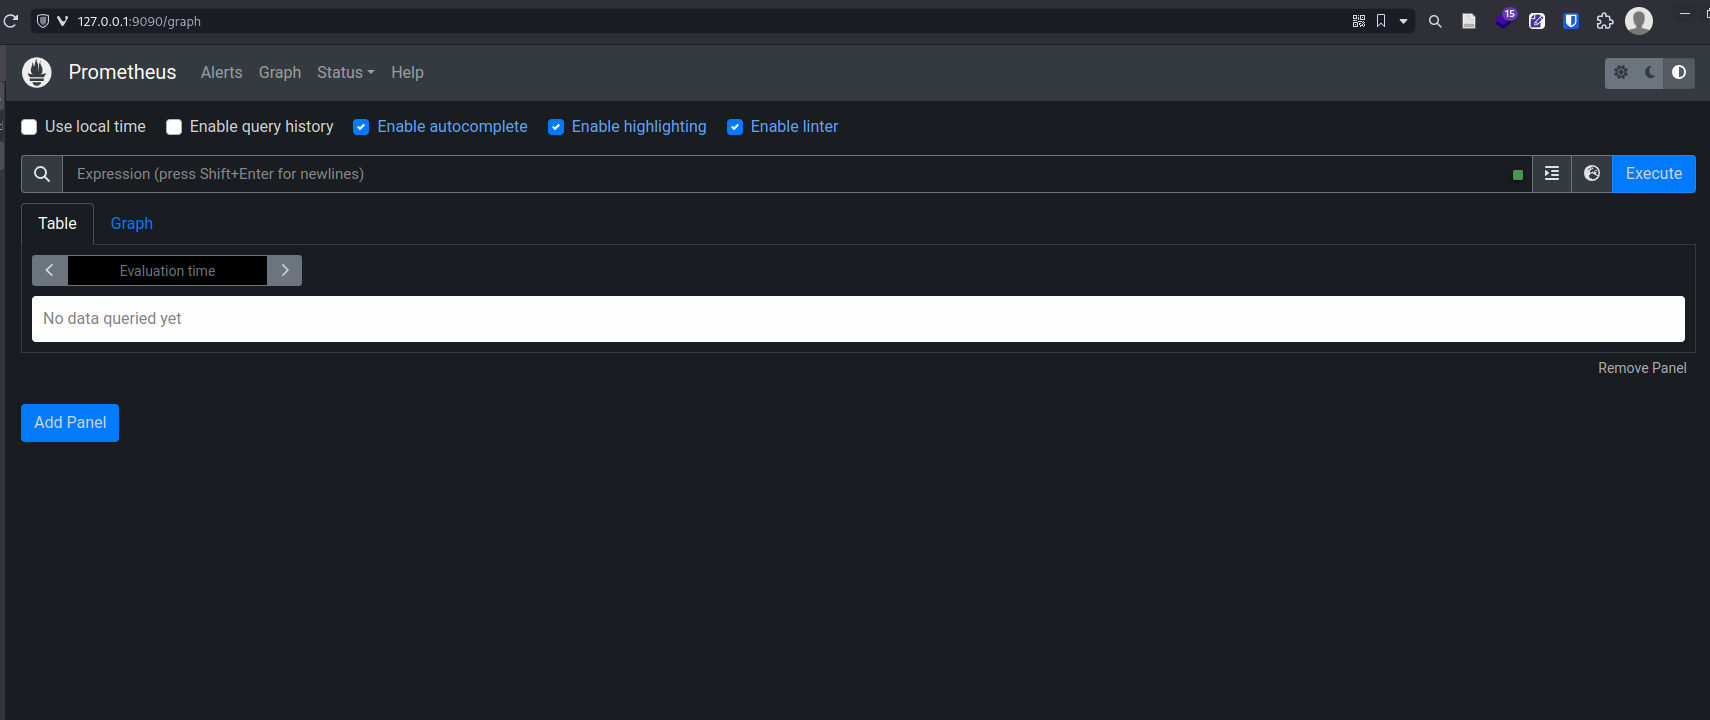
Access Prometheus in your web browser at http://localhost:9090.

-
By default, using this deployment, Prometheus scrapes data from the cluster using ServiceMonitor and also by default Grafana is connected to- and draws on Prometheus as a data source.
- Using Helm, we will install
Prometheus BlackBox Exporterto fetch data from theignappendpoint, translate the data to Prometheus Metrics, and expose the/metricsendpoint. The Helm chart will also Create a service for connecting to the exporter, and Configure ServiceMonitor with thevalueswe pass to it so Prometheus can discover the exporter.