- Description
- Technologies
- Challenges and Solutions
- MVP
- Stretch Goals
- Authors
emOceans is a simple web application that allows you to take note of your mood every day using color and language. Each day (and each mood, each memory) forms a tiny drop in the vast and ever-shifting ocean that is every human. We hope to make the observation and appreciation of those shifts and waves more accessible, helpful, and more beautiful.

- HTML/CSS/JavaScript
- jQuery
- Node.js/Express
- EJS
- MySQL
- chroma.js
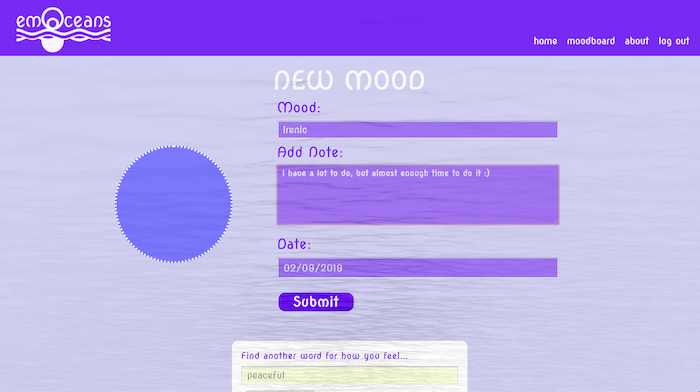
- datamuse API
-
Challenge: We're not using any charting or data visualization library to get our data to render beautifully!
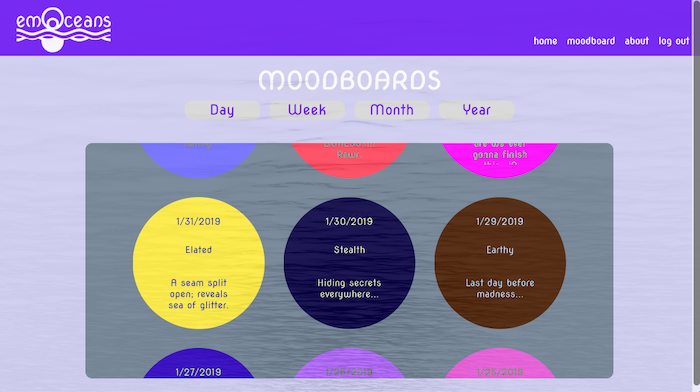
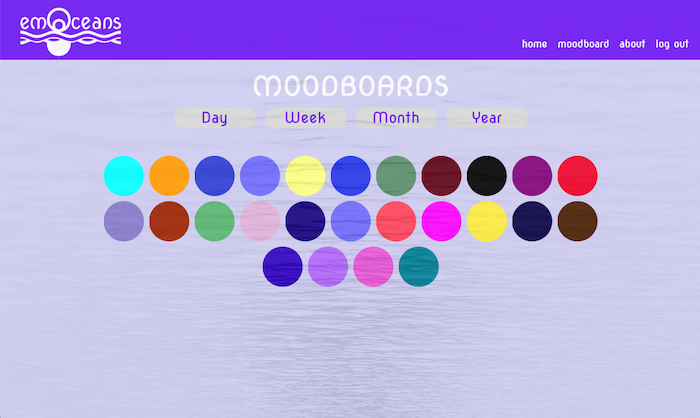
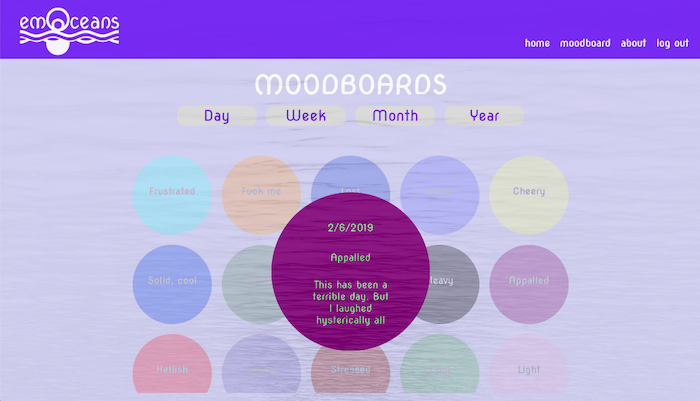
- Solution: We used the stringified results and variables for different chunks of time to style the "moodboards" accordingly, displaying data differently for days, weeks, months, and years.
- Solution: We used the stringified results and variables for different chunks of time to style the "moodboards" accordingly, displaying data differently for days, weeks, months, and years.
-
Challenge: Mobile/Desktop Design Differences. Interaction with the app differs vastly between different screen sizes, presenting challenges especially when working with add-on items, like a word-search API.
- Solution: Restructred HTML and CSS for better use of the word-search API on all screensizes.
-
Challenge: Scripting with data from the DB in the DOM with JSON.stringify.
- Solution: The scripting itself was not an issue, but syntactical confusion between the interfaces was; we worked this out for more specific CSS targeting with classes for better data visualization.


A front-and-backend web application, with responsive design, that allows a user to track mood using color and language. It also allows the user to easily view their moods overtime by taking note of shifts in color, and through clicking, scrolling or hovering, allows them to see mood/note for each day.

- Making the API results clickable to send to form.
- Rendering data with different sizes/styles/functionality depending on amount of time displayed (done!)
- Use of datamuse API on mobile/tablet (WIP)
- Seamless movement through data visualization even on small screens (likely use of a modal) (done!)
-
Jason Benson
- Contributions: Wireframes, UX concept, final design and logo, fonts, colors & images,CSS for main pages on mobile, tablet, and desktop, JavaScript for 'About' page, router set-up, log-in connection, database schema, database connection, frontend debugging, data visualization.
- GitHub Profile
-
Katie Duane
- Contributions: Concept, project management, wireframes, chroma.js implementation, datamuse API implementation, frontend JavaScript functionality, CSS for desktop/XL screens, router set-up, registration connection, database schema, database connection, router debugging, backend and frontend debugging, data visualization.
- GitHub Profile
-
Christopher Soltis
- Contributions: Wireframes, HTML and CSS for splash/login/registration, CSS for mobile (hamburger) menu, database schema stage 1, router debugging.
- GitHub Profile