This microservices branch was initially derived from the microservices version to demonstrate how to split sample Spring application into microservices. To achieve that goal we use Spring Cloud Gateway, Spring Cloud Circuit Breaker, Spring Cloud Sleuth, Resilience4j, and Micrometer. While running on Kubernetes, some components (such as Spring Cloud Config and Eureka Service Discovery) are replaced with Kubernetes-native features such as config maps and Kubernetes DNS resolution.
This fork also demostrates the use of free distributed tracing with Tanzu Observability by Wavefront, which provides cloud-based monitoring of Spring Boot applications with 5 days of history.
See the presentation of the Spring Petclinic Framework version
A blog bost introducing the Spring Petclinic Microsevices (french language)
You can then access petclinic here: http://localhost:8080/
This application uses Wavefront as a SaaS that can provide free Spring Boot monitoring and Open Tracing for your application. If you'd like to remove the Wavefront integration, please remove the wavefront user-provided service reference from manifest.yml.
Otherwise, generate a free wavefront token by running one of the apps, for example:
cd spring-petclinic-api-gateway
mvn spring-boot:run
You will see something like this in the logs:
A Wavefront account has been provisioned successfully and the API token has been saved to disk.

To share this account, make sure the following is added to your configuration:

	management.metrics.export.wavefront.api-token=2e41f7cf-1111-2222-3333-7397a56113ca
	management.metrics.export.wavefront.uri=https://wavefront.surf

Connect to your Wavefront dashboard using this one-time use link:
https://wavefront.surf/us/AAA4s5f8xJ9yD
You free account has now been created.
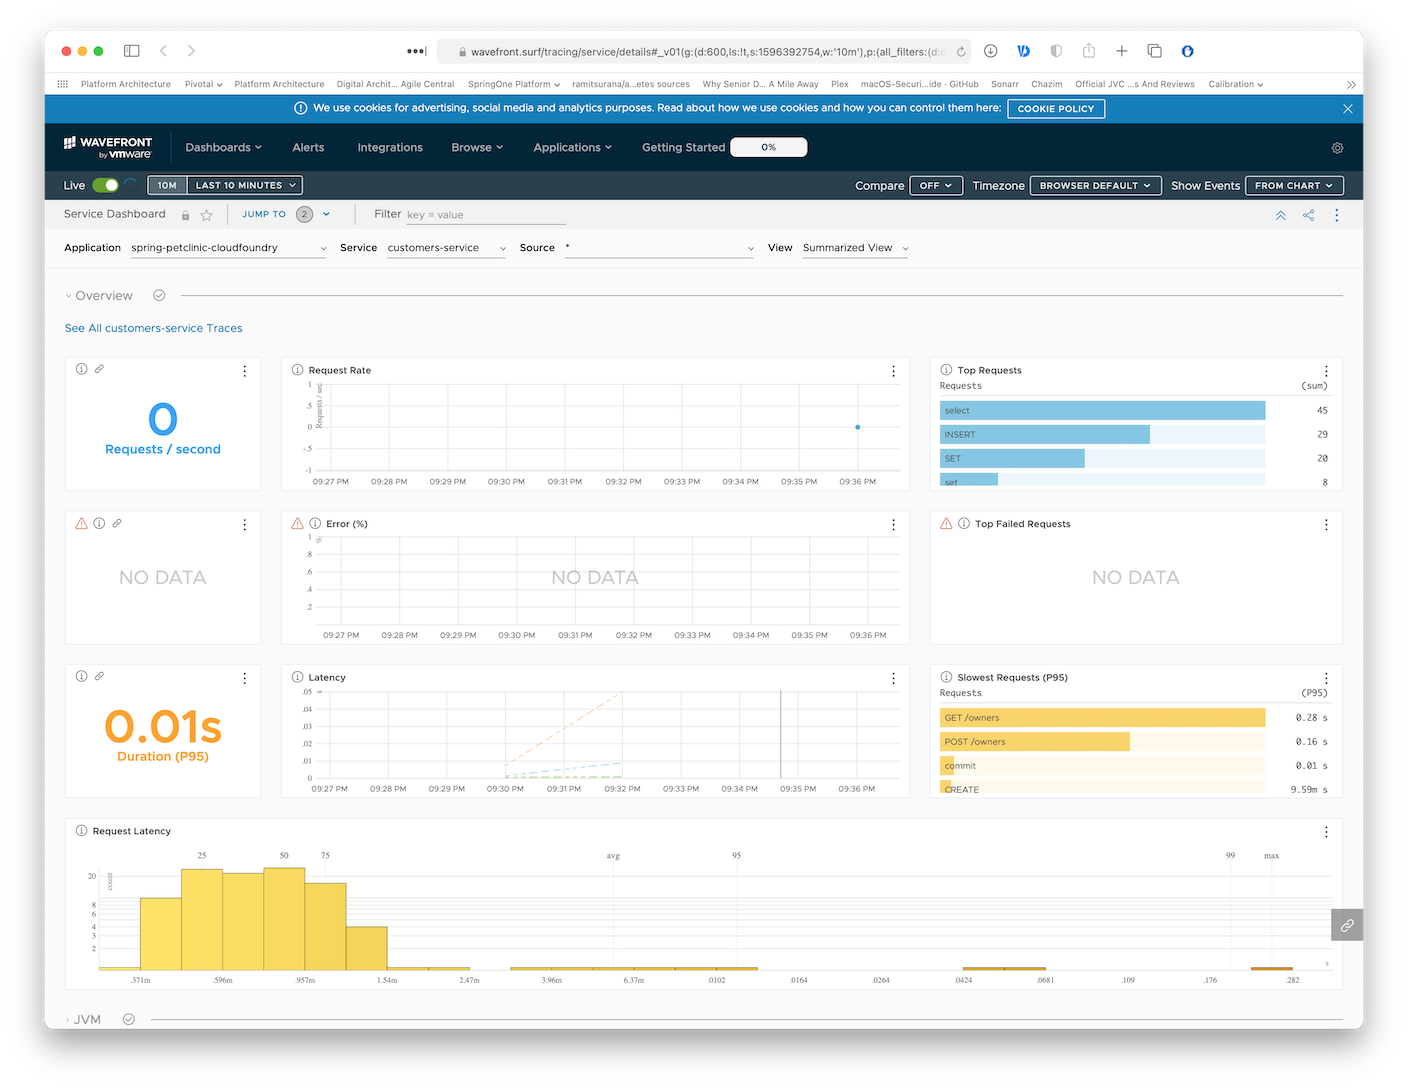
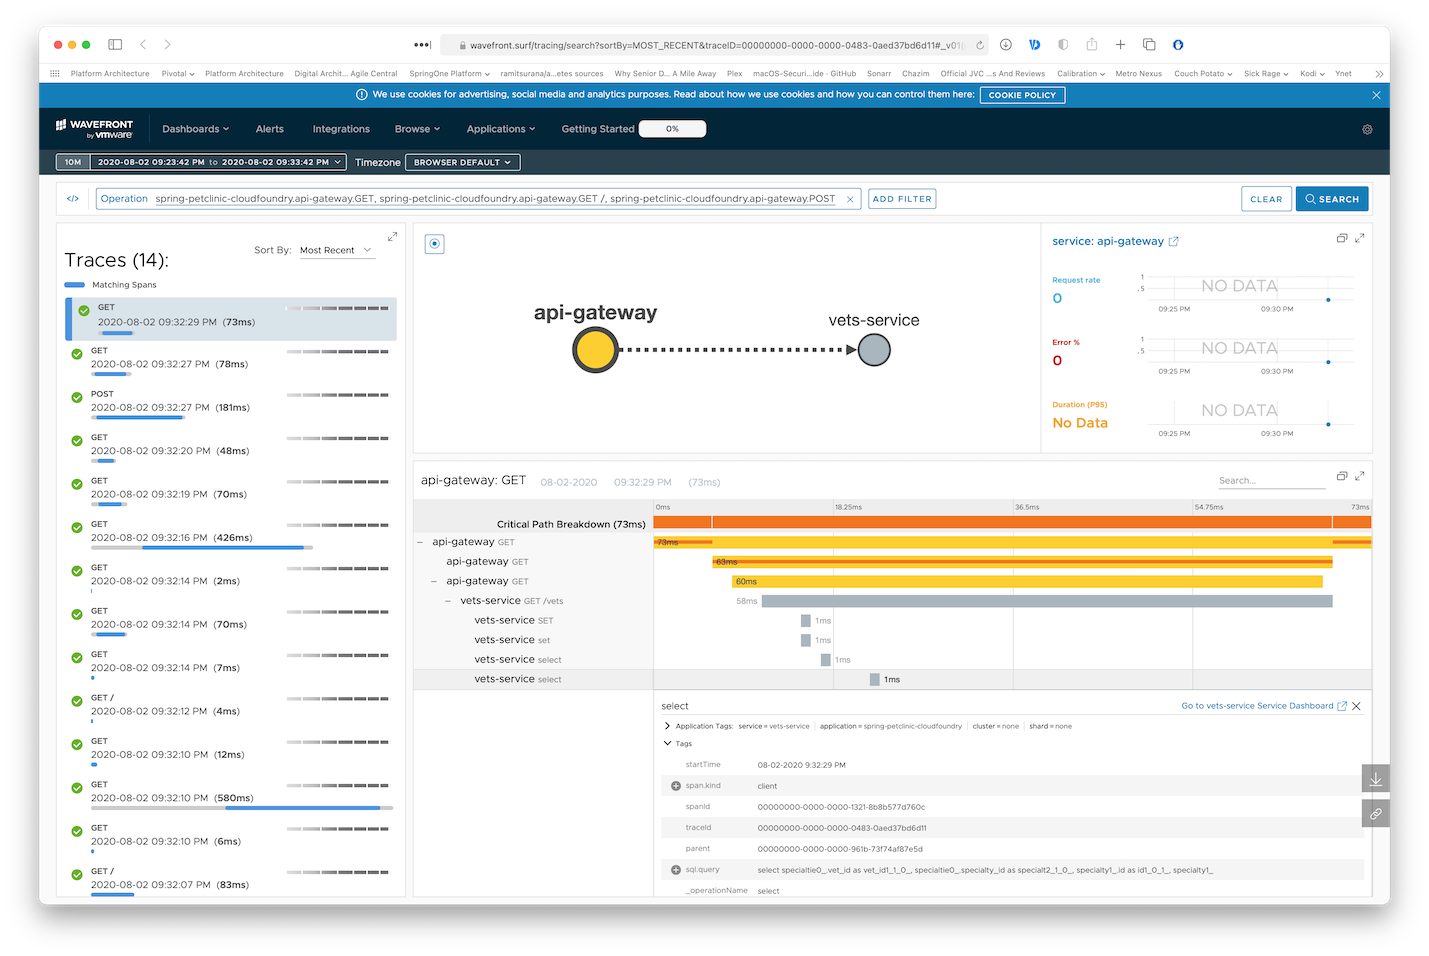
Access the one-time URL you received when bootstraping Wavefront to see Zipkin traces and other monitoring of your microservices:
Since we've included brave.mysql8 in our pom.xml, the traces even show the various DB queries traces:
This get a little bit more complicated when deploying to Kubernetes, since we need to manage Docker images, exposing services and more yaml. But we can pull through!
You need to define your target Docker registry. Make sure you're already logged in by running docker login <endpoint> or docker login if you're just targeting Docker hub.
Setup an env varible to target your Docker registry. If you're targeting Docker hub, simple provide your username, for example:
export REPOSITORY_PREFIX=odedia
For other Docker registries, provide the full URL to your repository, for example:
export REPOSITORY_PREFIX=harbor.myregistry.com/demo
One of the neat features in Spring Boot 2.3 is that it can leverage Cloud Native Buildpacks and Paketo Buildpacks to build production-ready images for us. Since we also configured the spring-boot-maven-plugin to use layers, we'll get optimized layering of the various components that build our Spring Boot app for optimal image caching. What this means in practice is that if we simple change a line of code in our app, it would only require us to push the layer containing our code and not the entire uber jar. To build all images and pushing them to your registry, run:
mvn spring-boot:build-image -Pk8s -DREPOSITORY_PREFIX=${REPOSITORY_PREFIX} && ./scripts/pushImages.sh
Since these are standalone microservices, you can also cd into any of the project folders and build it indivitually (as well as push it to the registry).
You should now have all your images in your Docke registry. It might be good to make sure you can see them available.
Make sure you're targeting your Kubernetes cluster
Create the spring-petclinic namespace for Spring petclinic:
kubectl apply -f k8s/init-namespace/
Create a Kubernetes secret to store the URL and API Token of Wavefront (replace values with your own real ones):
kubectl create secret generic wavefront -n spring-petclinic --from-literal=wavefront-url=https://wavefront.surf --from-literal=wavefront-api-token=2e41f7cf-1111-2222-3333-7397a56113ca
Create the Wavefront proxy pod, and the various Kubernetes services that will be used later on by our deployments:
kubectl apply -f k8s/init-services
Verify the services are available:
✗ kubectl get svc -n spring-petclinic
NAME                TYPE           CLUSTER-IP     EXTERNAL-IP   PORT(S)             AGE
api-gateway         LoadBalancer   10.7.250.24    <pending>     80:32675/TCP        36s
customers-service   ClusterIP      10.7.245.64    <none>        8080/TCP            36s
vets-service        ClusterIP      10.7.245.150   <none>        8080/TCP            36s
visits-service      ClusterIP      10.7.251.227   <none>        8080/TCP            35s
wavefront-proxy     ClusterIP      10.7.253.85    <none>        2878/TCP,9411/TCP   37s
Verify the wavefront proxy is running:
✗ kubectl get pods -n spring-petclinic
NAME                              READY   STATUS    RESTARTS   AGE
wavefront-proxy-dfbd4b695-fdd6t   1/1     Running   0          36s
We'll now need to deploy our databases. For that, we'll use helm. You'll need helm 3 and above since we're not using Tiller in this deployment.
Make sure you have a single default StorageClass in your Kubernetes cluster:
✗ kubectl get sc
NAME                 PROVISIONER            AGE
standard (default)   kubernetes.io/gce-pd   6h11m
Deploy the databases:
helm repo add bitnami https://charts.bitnami.com/bitnami
helm repo update
helm install vets-db-mysql bitnami/mysql --namespace spring-petclinic --version 6.14.3 --set db.name=service_instance_db
helm install visits-db-mysql bitnami/mysql --namespace spring-petclinic  --version 6.14.3 --set db.name=service_instance_db
helm install customers-db-mysql bitnami/mysql --namespace spring-petclinic  --version 6.14.3 --set db.name=service_instance_db
Our deployment YAMLs have a placeholder called REPOSITORY_PREFIX so we'll be able to deploy the images from any Docker registry. Sadly, Kubernetes doesn't support environment variables in the YAML descriptors. We have a small script to do it for us and run our deployments:
./scripts/deployToKubernetes.sh
Verify the pods are deployed:
✗ kubectl get pods -n spring-petclinic
NAME                                 READY   STATUS    RESTARTS   AGE
api-gateway-585fff448f-q45jc         1/1     Running   0          4m20s
customers-db-mysql-master-0          1/1     Running   0          11m
customers-db-mysql-slave-0           1/1     Running   0          11m
customers-service-5d7d686654-kpcmx   1/1     Running   0          4m19s
vets-db-mysql-master-0               1/1     Running   0          11m
vets-db-mysql-slave-0                1/1     Running   0          11m
vets-service-85cb8677df-l5xpj        1/1     Running   0          4m2s
visits-db-mysql-master-0             1/1     Running   0          11m
visits-db-mysql-slave-0              1/1     Running   0          11m
visits-service-654fffbcc7-zj2jw      1/1     Running   0          4m2s
wavefront-proxy-dfbd4b695-fdd6t      1/1     Running   0          14m
Get the EXTERNAL-IP of the API Gateway:
✗ kubectl get svc -n spring-petclinic api-gateway
NAME          TYPE           CLUSTER-IP    EXTERNAL-IP      PORT(S)        AGE
api-gateway   LoadBalancer   10.7.250.24   34.1.2.22   80:32675/TCP   18m
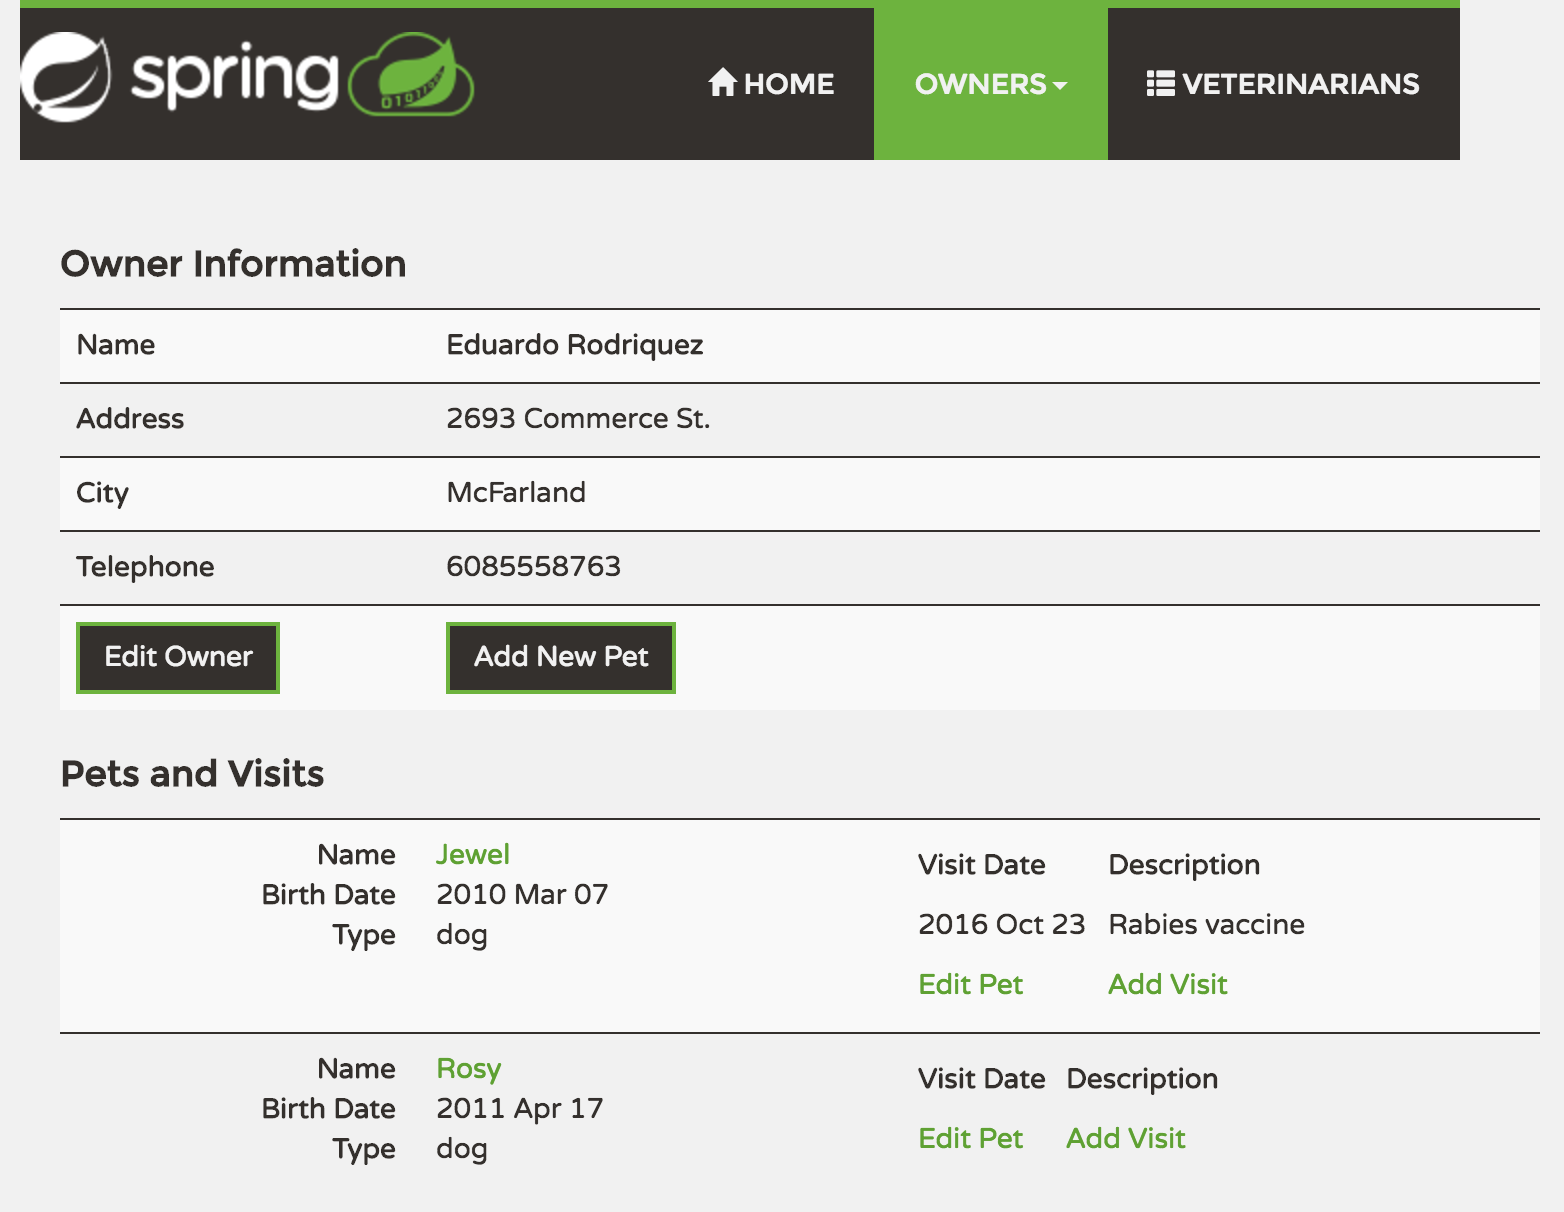
You can now brose to that IP in your browser and see the application running.
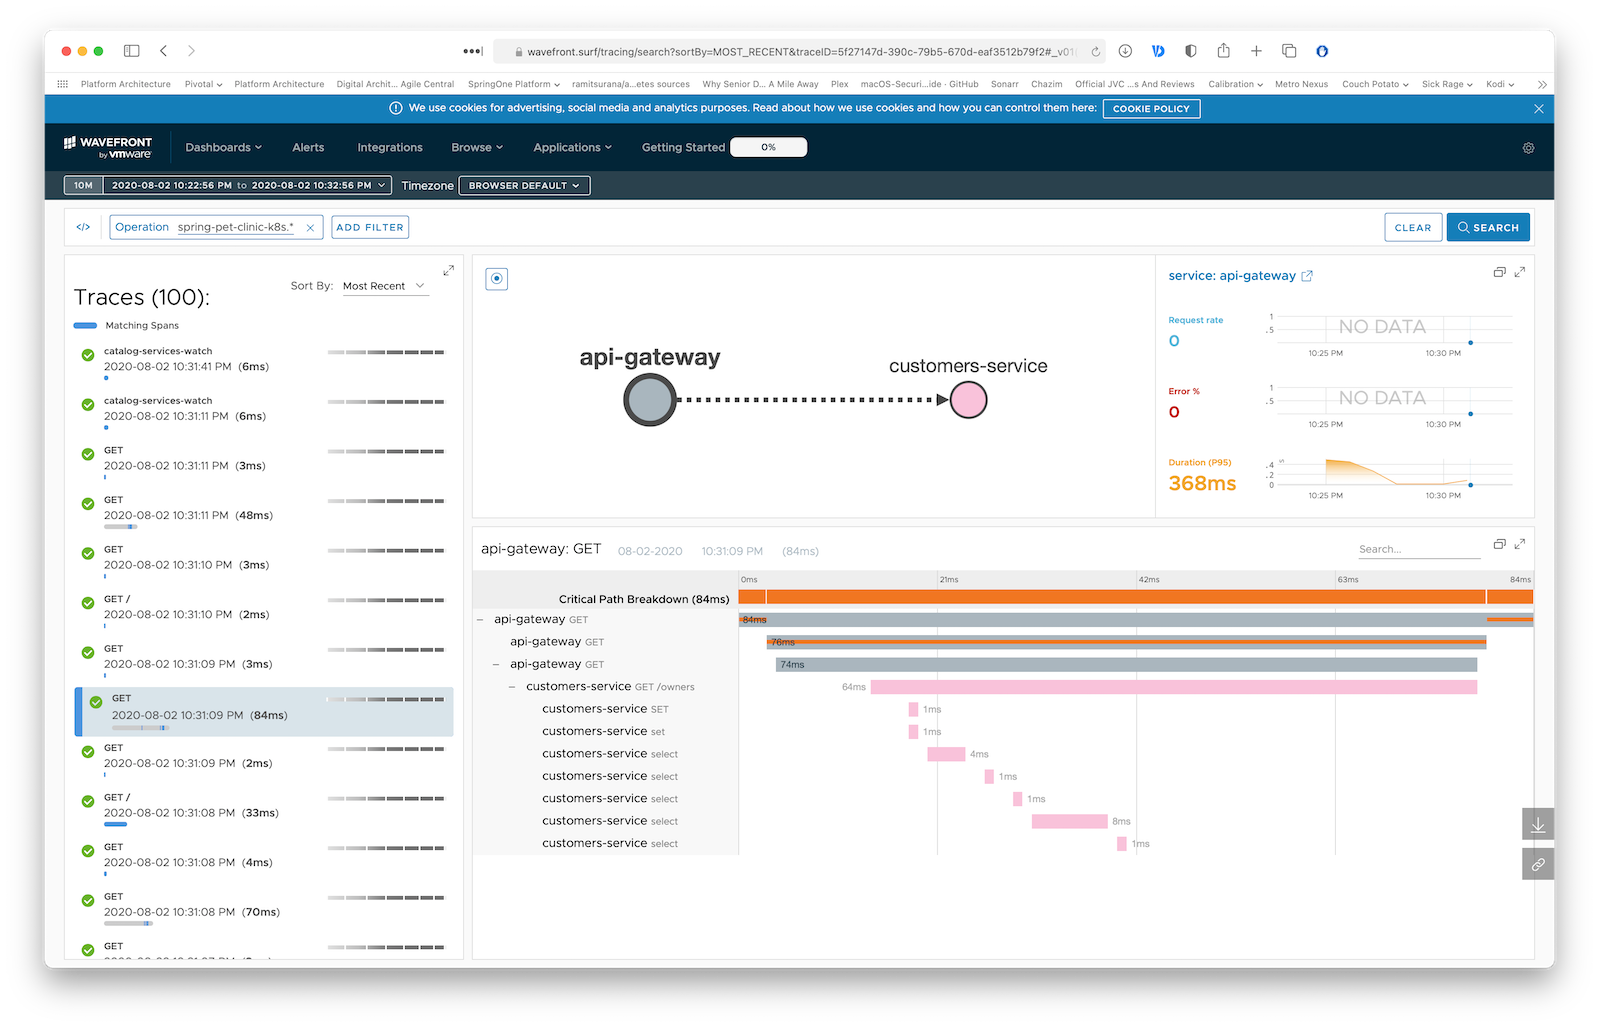
You should also see monitoring and traces from Wavefront under the application name spring-petclinic-k8s:
Every microservice is a Spring Boot application and can be started locally using IDE or ../mvnw spring-boot:run command. Please note that supporting services (Config and Discovery Server) must be started before any other application (Customers, Vets, Visits and API).
Startup of Tracing server, Admin server, Grafana and Prometheus is optional.
If everything goes well, you can access the following services at given location:
- Discovery Server - http://localhost:8761
- Config Server - http://localhost:8888
- AngularJS frontend (API Gateway) - http://localhost:8080
- Customers, Vets and Visits Services - random port, check Eureka Dashboard
- Tracing Server (Zipkin) - http://localhost:9411/zipkin/ (we use openzipkin)
- Admin Server (Spring Boot Admin) - http://localhost:9090
- Grafana Dashboards - http://localhost:3000
- Prometheus - http://localhost:9091
You can tell Config Server to use your local Git repository by using native Spring profile and setting
GIT_REPO environment variable, for example:
-Dspring.profiles.active=native -DGIT_REPO=/projects/spring-petclinic-microservices-config
In order to start entire infrastructure using Docker, you have to build images by executing ./mvnw clean install -P buildDocker
from a project root. Once images are ready, you can start them with a single command
docker-compose up. Containers startup order is coordinated with dockerize script.
After starting services it takes a while for API Gateway to be in sync with service registry,
so don't be scared of initial Spring Cloud Gateway timeouts. You can track services availability using Eureka dashboard
available by default at http://localhost:8761.
The master branch uses an Alpine linux with JRE 8 as Docker base. You will find a Java 11 version in the release/java11 branch.
NOTE: Under MacOSX or Windows, make sure that the Docker VM has enough memory to run the microservices. The default settings
are usually not enough and make the docker-compose up painfully slow.
Our issue tracker is available here: https://github.com/spring-petclinic/spring-petclinic-cloud/issues
In its default configuration, Petclinic uses an in-memory database (HSQLDB) which gets populated at startup with data.
A similar setup is provided for MySql in case a persistent database configuration is needed.
Dependency for Connector/J, the MySQL JDBC driver is already included in the pom.xml files.
You may start a MySql database with docker:
docker run -e MYSQL_ROOT_PASSWORD=petclinic -e MYSQL_DATABASE=petclinic -p 3306:3306 mysql:5.7.8
or download and install the MySQL database (e.g., MySQL Community Server 5.7 GA), which can be found here: https://dev.mysql.com/downloads/
To use a MySQL database, you have to start 3 microservices (visits-service, customers-service and vets-services)
with the mysql Spring profile. Add the --spring.profiles.active=mysql as programm argument.
By default, at startup, database schema will be created and data will be populated.
You may also manually create the PetClinic database and data by executing the "db/mysql/{schema,data}.sql" scripts of each 3 microservices.
In the application.yml of the Configuration repository, set the initialization-mode to never.
If you are running the microservices with Docker, you have to add the mysql profile into the (Dockerfile)[docker/Dockerfile]:
ENV SPRING_PROFILES_ACTIVE docker,mysql
In the mysql section of the application.yml from the Configuration repository, you have to change
the host and port of your MySQL JDBC connection string.
Grafana and Prometheus are included in the docker-compose.yml configuration, and the public facing applications
have been instrumented with MicroMeter to collect JVM and custom business metrics.
A JMeter load testing script is available to stress the application and generate metrics: petclinic_test_plan.jmx
- Prometheus can be accessed from your local machine at http://localhost:9091
- An anonymous access and a Prometheus datasource are setup.
- A
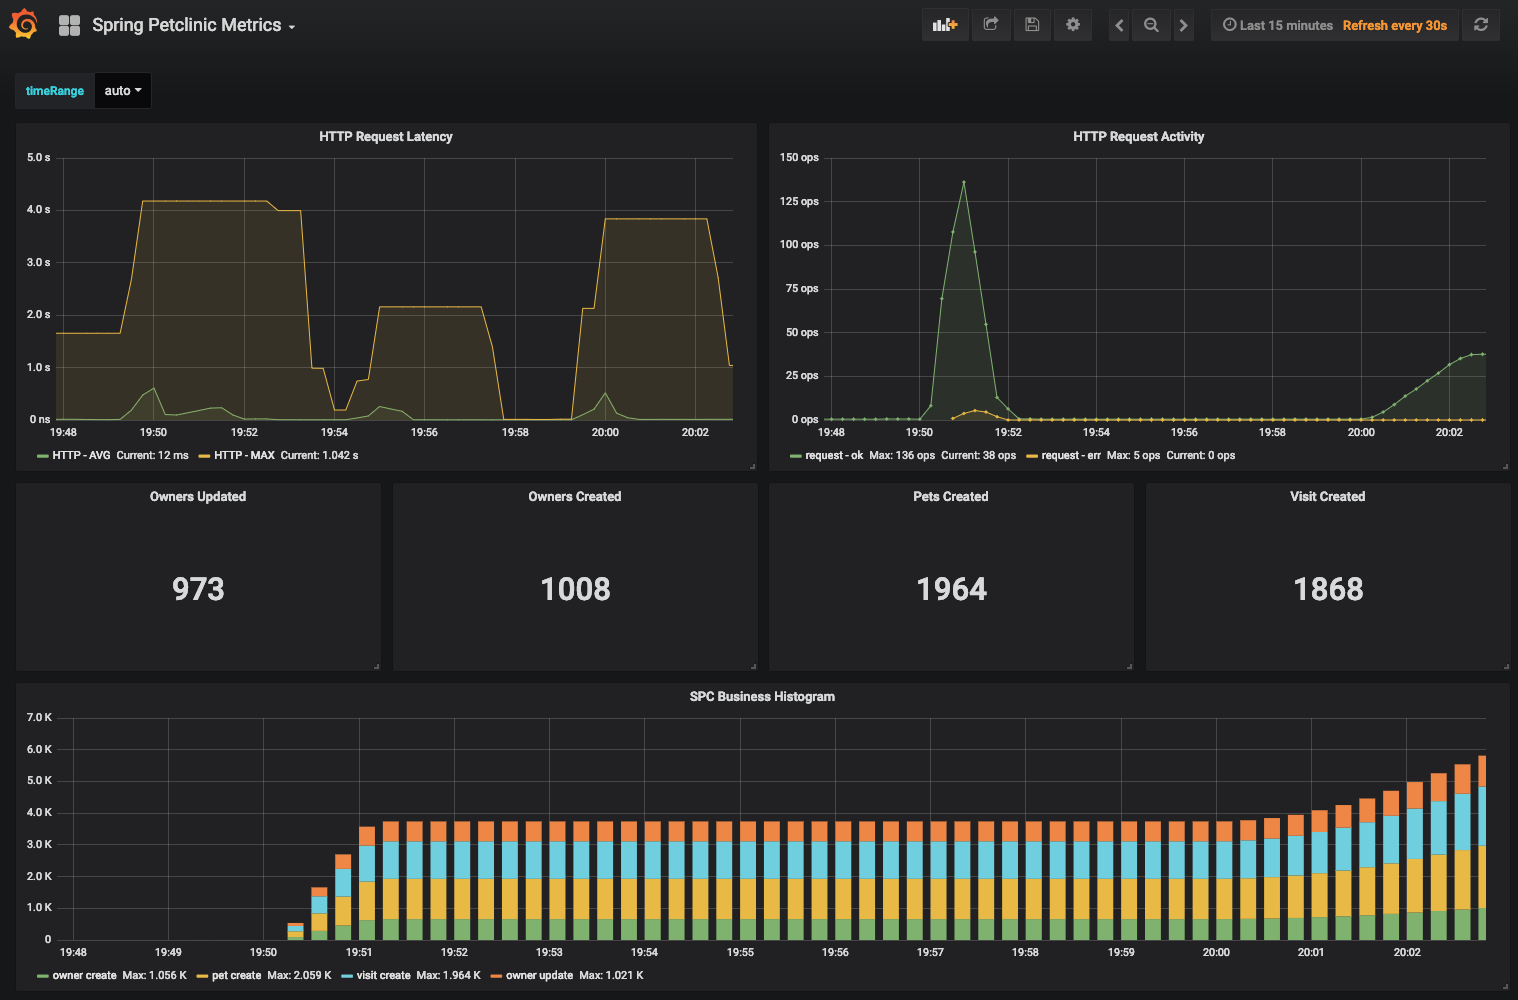
Spring Petclinic MetricsDashboard is available at the URL http://localhost:3000/d/69JXeR0iw/spring-petclinic-metrics. You will find the JSON configuration file here: docker/grafana/dashboards/grafana-petclinic-dashboard.json. - You may create your own dashboard or import the Micrometer/SpringBoot dashboard via the Import Dashboard menu item.
The id for this dashboard is
4701.
Spring Boot registers a lot number of core metrics: JVM, CPU, Tomcat, Logback...
The Spring Boot auto-configuration enables the instrumentation of requests handled by Spring MVC.
All those three REST controllers OwnerResource, PetResource and VisitResource have been instrumented by the @Timed Micrometer annotation at class level.
customers-serviceapplication has the following custom metrics enabled:- @Timed:
petclinic.owner - @Timed:
petclinic.pet
- @Timed:
visits-serviceapplication has the following custom metrics enabled:- @Timed:
petclinic.visit
- @Timed:
| Spring Cloud components | Resources |
|---|---|
| Configuration server | Config server properties and Configuration repository |
| Service Discovery | Eureka server and Service discovery client |
| API Gateway | Spring Cloud Gateway starter and Routing configuration |
| Docker Compose | Spring Boot with Docker guide and docker-compose file |
| Circuit Breaker | Resilience4j fallback method |
| Grafana / Prometheus Monitoring | Micrometer implementation, Spring Boot Actuator Production Ready Metrics |
The Spring Petclinic master branch in the main spring-projects GitHub org is the "canonical" implementation, currently based on Spring Boot and Thymeleaf.
This spring-petclinic-cloud project is one of the several forks hosted in a special GitHub org: spring-petclinic. If you have a special interest in a different technology stack that could be used to implement the Pet Clinic then please join the community there.
The issue tracker is the preferred channel for bug reports, features requests and submitting pull requests.
For pull requests, editor preferences are available in the editor config for easy use in common text editors. Read more and download plugins at http://editorconfig.org.

