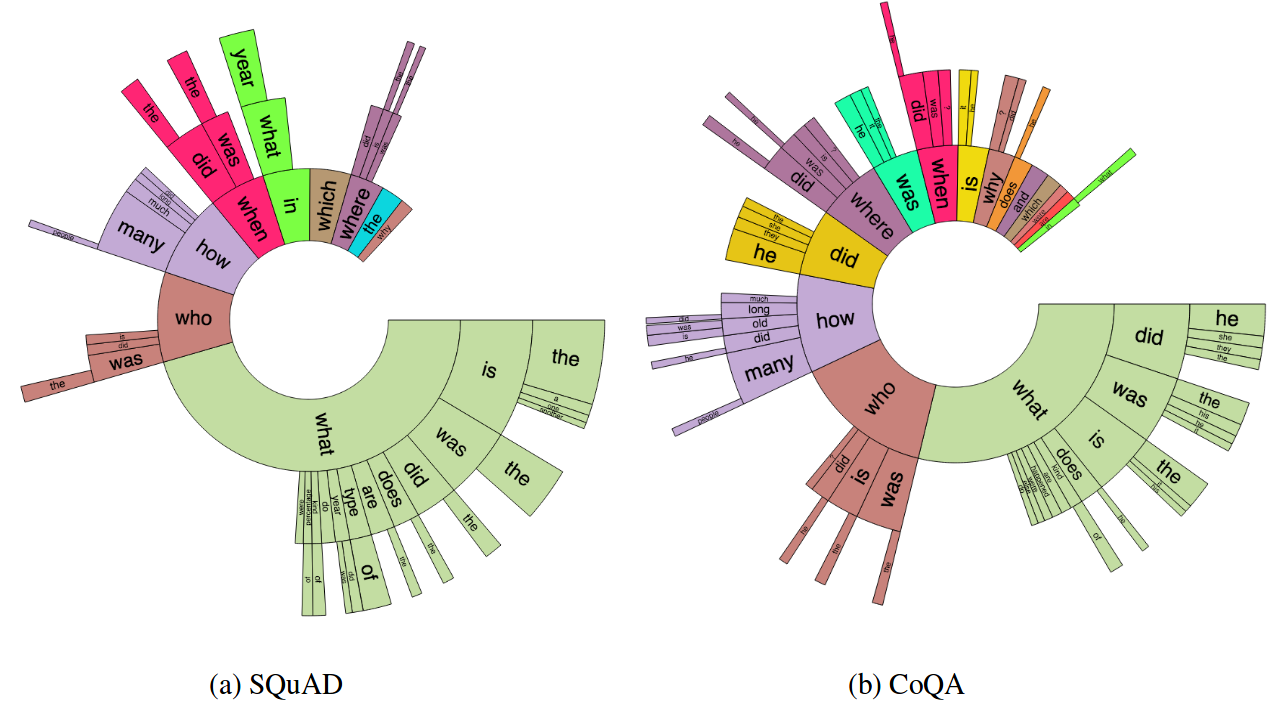
A simple Python implementation of ngram sunburst (nested pie chart) visualization showed in this paper: CoQA: A Conversational Question Answering Challenge, 2018 (https://arxiv.org/pdf/1808.07042.pdf)
With its beautiful "Figure 3: Distribution of trigram prefixes of questions in SQuAD and CoQA" as follows:
Fig 1:Original paper figureHere are some basic arguments to run the Analysis.py:
parser.add_argument('-read', help='read from', default="example.txt")
parser.add_argument('-ngram', help='ngram', type=int, default=3)
parser.add_argument('-max_display_num', help='max number of ngrams to display',
                    type=int, default=3)
parser.add_argument('-min_count', help='min word occurence below which the word will not be displayed',
                    type=int, default=1)
parser.add_argument('-adjust_value', help='adjust node value for better visulization',
                    type=int, default=1)
parser.add_argument('-adjust_ratio', help='the total ratio taken up by child nodes',
                    type=float, default=0.65)
Simple run in a console
python Analysis.py -read=example.txtThe ngrams are stored through Trie structure, which is later pruned based on max_display_num and min_count arguments.
The arguments are rather simple despite maybe the last two: adjust_value is a boolean value (1 or 0) indicating whether or not to adjust the ngram value for better visualization. It's recommanded when visualizing ngrams from a large corpus, for the distribution are always too sparse to visualize. When adjust_value=1, all sub-words of an ngram will be adjusted to take up adjust_ratio of radian of the father-word.
See the below two figures (representing the same distribution) for a straight-forward understanding.
Fig 2:Adjusted 3-gram visualization (adjust_ratio=0.9 (left) and adjust_ratio=0.65 (right)) for example.txt
