Content to assist customers in optimizing logging for workloads that run on Azure Kubernetes Service.
Log Analytics Workspace support on-ingestion transformation for specific tables. Luckily the ContainerLog and ContainerLogv2 tables are both supported. This feature means you can reduce the logging cost of your AKS clusters by filtering out unneeded logs. Additionally, it allows you to drop any logs containing Personal Identifiable Information before they are ingested.
Investigate the logs being generated by pods in your cluster and create a list of messages that you'd like to exclude from ingestion.
Some suggestions are:
kube-probe: As every pod will have a readiness and liveness health check setup, usually every 10seconds or so. Log messages generated by these checks can be noisy./health: Similar to the abovekube-probecomment, if the pod logs out it's health check path or a success message.
By removing even just the above 2 examples you might be able to dramatically reduce your log ingestion passively. It all depends on what your workloads are logging.
A Data Collection Rule to exclude the above would look like:
source | where LogMessage !has "health"| where LogMessage !has "kube-probe"
This repository contains Bicep modules to deploy the above DCR filters on a Log Analytics workspace. Update the parameters in the dcr.bicepparam file. The code provided is an example, use at your own desecration as it's only provided as a quick start.
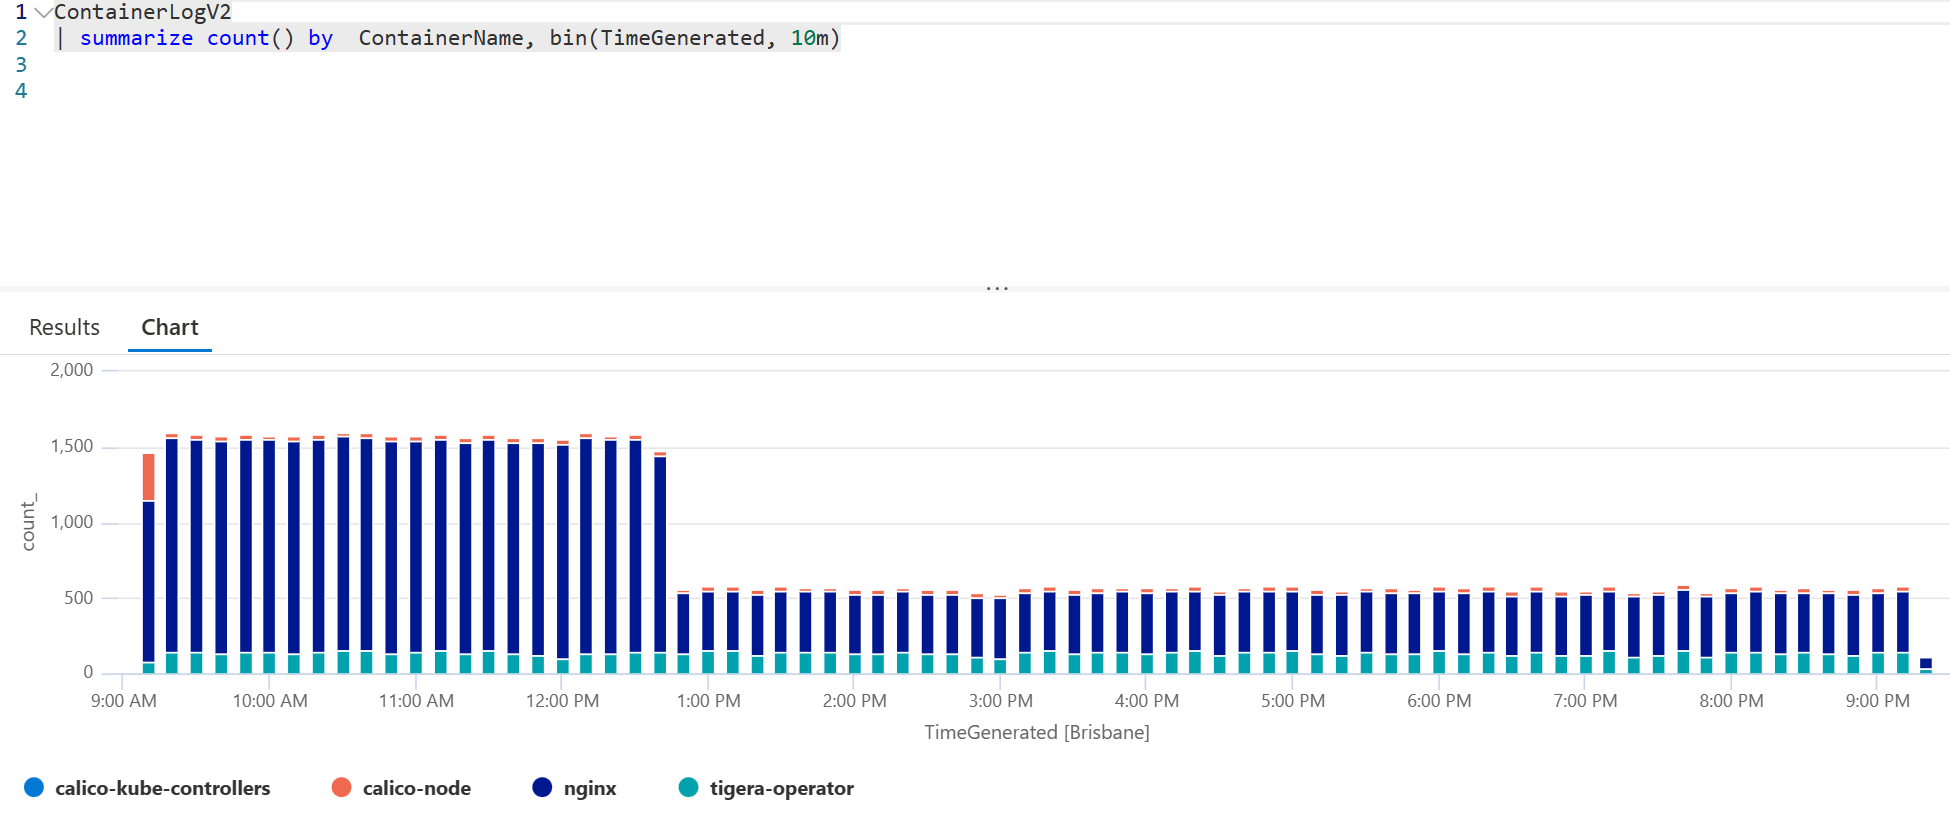
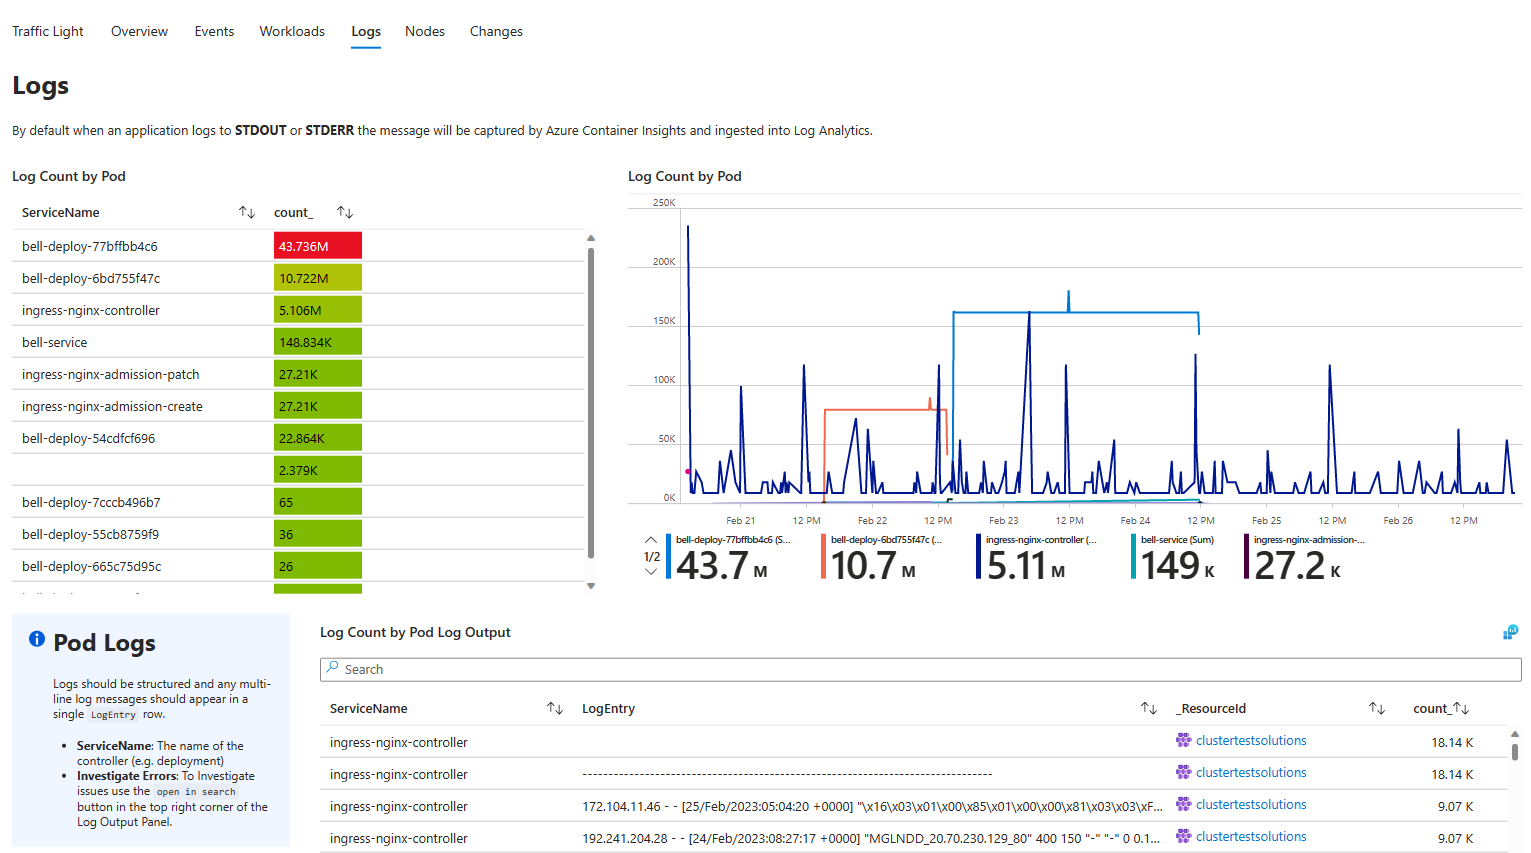
To make the most of the DCR, review your Pod Logs and identify any noisy / unhelpful log messages. Ideally applications should only log useful information. To quick start reviewing your pod logs import my AKS Workbook and navigate to the logs table.
Note: Always test the query you're adding to the DRC before implementing it. Adding a
hasKQL query may exclude more logs than intended.
Note: DCRs take 30 minutes to take affect after the initial creation.
Note: There may already be a DCR on your cluster for various reasons.
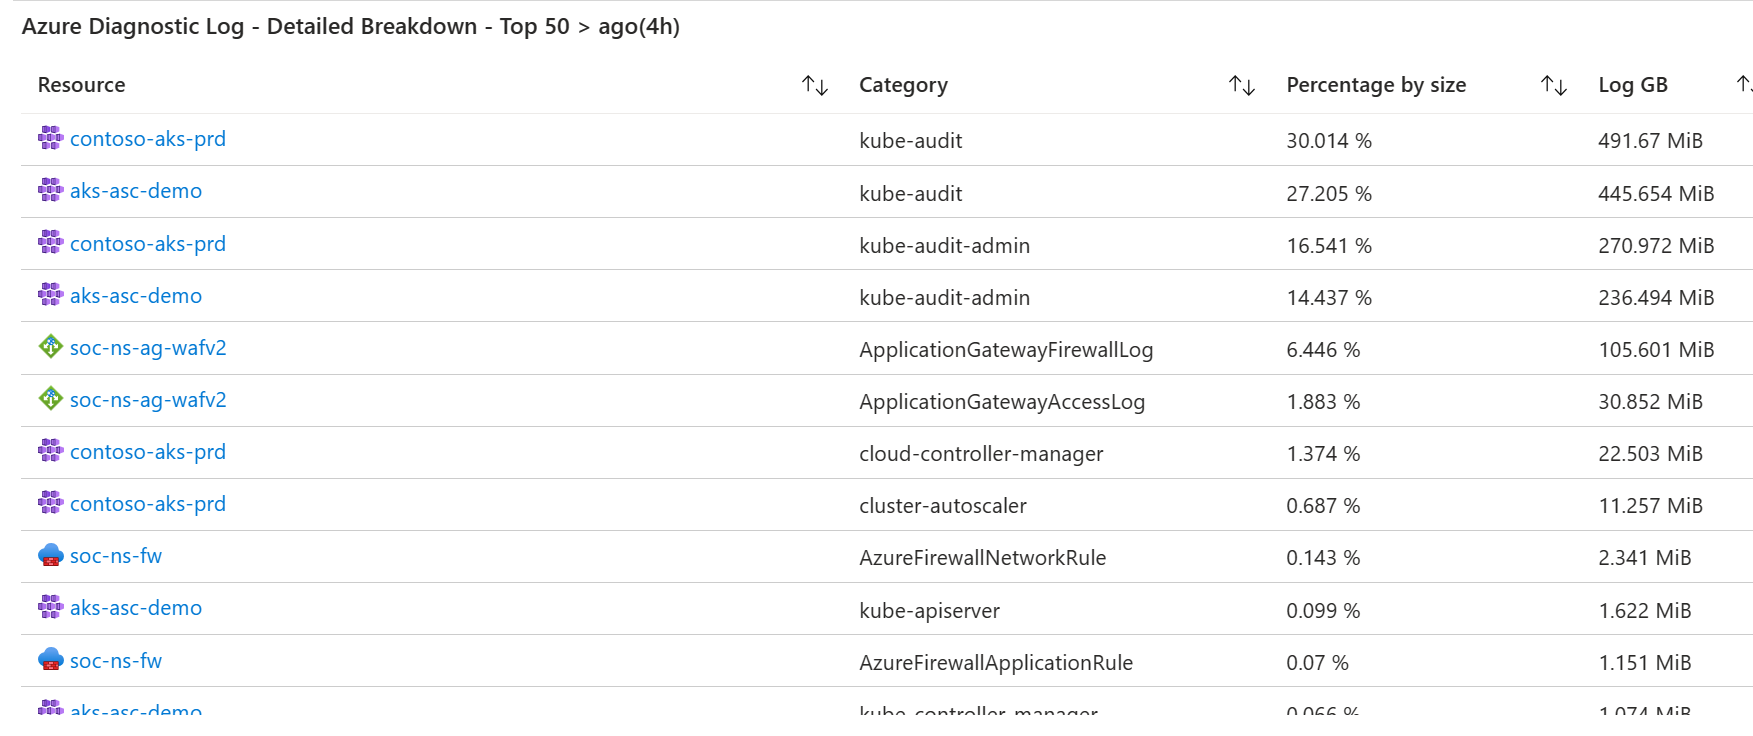
The azureDiagnostics.json file contains an Azure Workbook which audits Azure Diagnostic settings that are ingested into Log Analytics Workspaces. It visualises the data and provides data driven insights into your environment.
For AKS in particular it displays whether the kube-audit and kube-admin-audit logs are both being captured for a cluster. The kube-audit-admin log is a subnet of kube-audit. Customers should enable one or the other, not both.
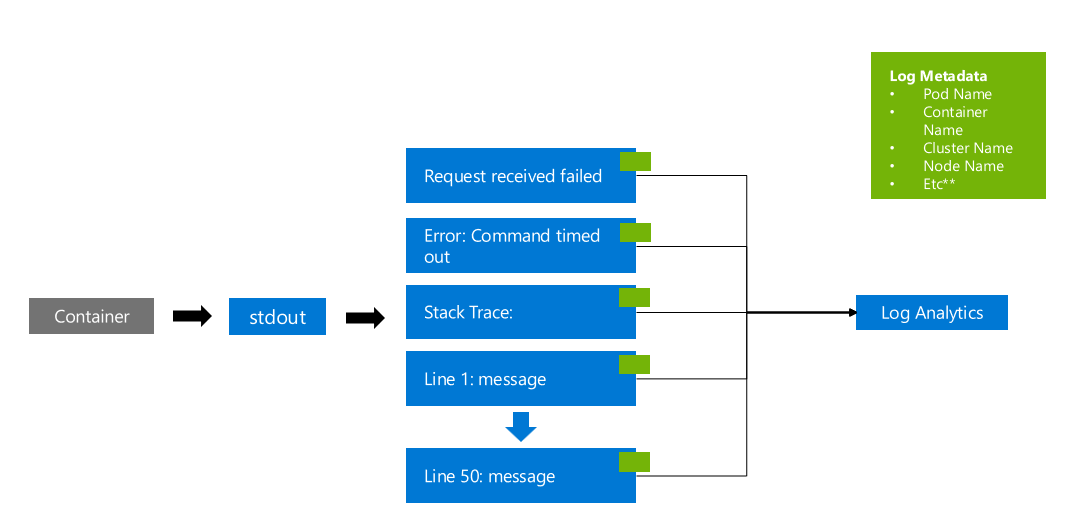
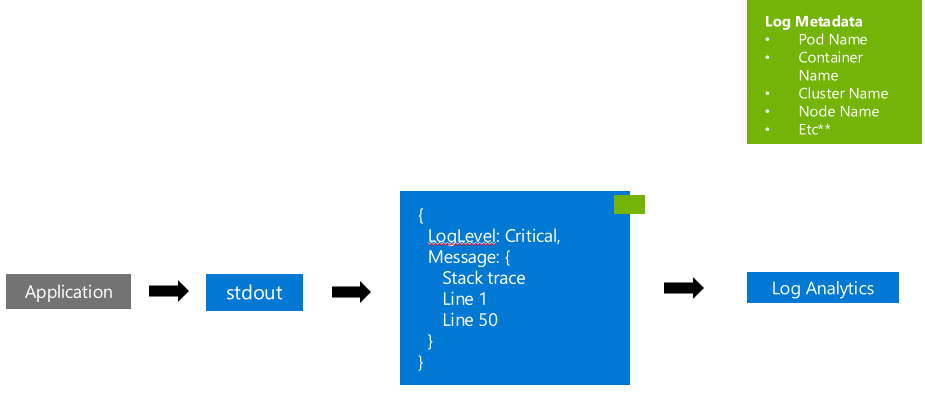
When a container writes a message to stdout or stderr it will be picked up and captured by ContainerInsights (by default, when enabled on a cluster).
This can cause multiline log messages to be ingested as separate log messages, a crude example of this is (to visualize the issue):
The above example shows a container logging a non-stringified payload to STDOUT. The payload contains a stacktrace (error dump). It causes the log message to be split into multiple lines. This:
- Increases the cost as each row has metadata.
- Makes it challenging to troubleshoot as the data isn't grouped correctly.
This log message should instead be written to STDOUT or STDERR as a stringified JSON object. ContainerInsights will pickup and store the log like:
Note: The above is just an example of a structured log message. For guidance on application logging review the following guide.
There's some new features that have been released for ContainerInsights that are aimed at reducing the logging costs. These benefits are available when you upgrade to the new ContainerLogV2 format. A few useful features are:
- Multiline Log Parsing
- Reducing Ingestion Frequency
- Basic logs
For more information review the cost optimisation document.
But always look at the Container Insights collection configmap and disable settings you don't need.
- An example could be that you've deployed Prometheus into your AKS cluster and you've still got AMA scrapping pods with Prometheus Annotations.
