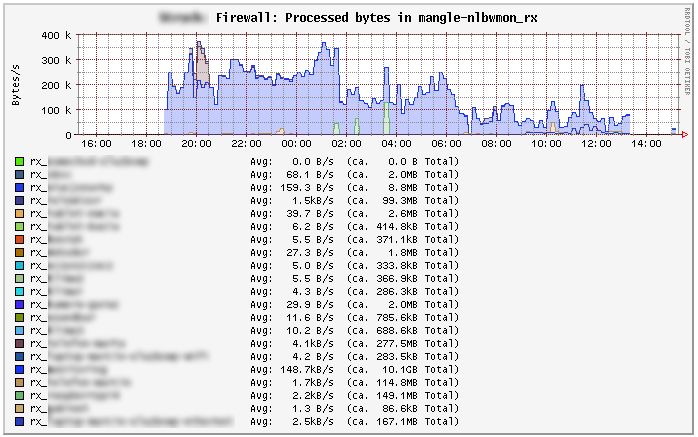
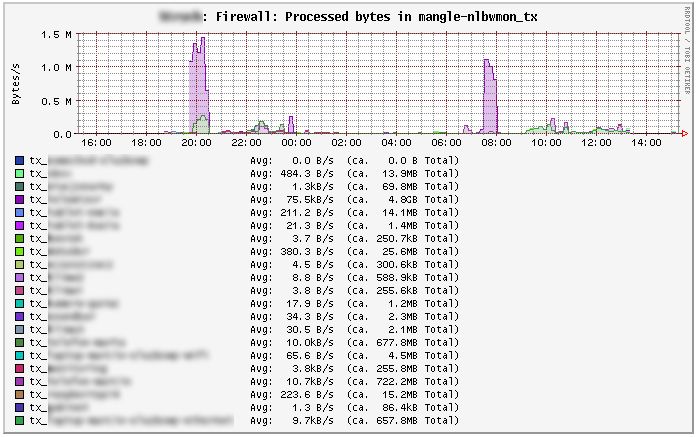
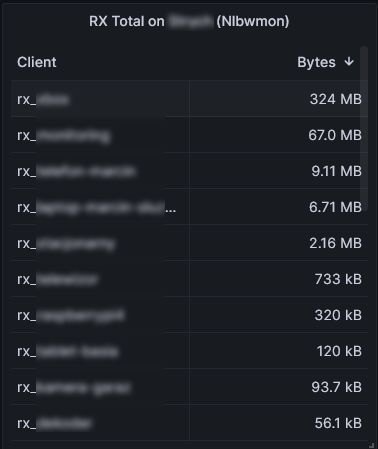
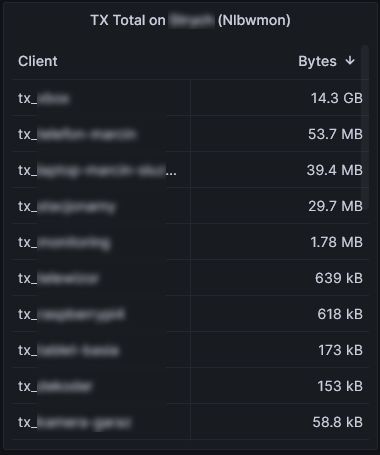
This collectd lua plugin allows you to put Nlbwmon statistics directly to Collectd (luci-app-statistics). By default on Openwrt statistics are uploaded every 30 seconds, so it allows you to get pseudo realtime statistic about the traffic on your router.
I have been using Iptmon tool to get very nice statistics of per host traffic on my Openwrt router. Unfortunatelly starting from Openwrt 22.03 release Iptmon stopped to work due to replacement of iptables with nftables. When looking for alternatives I was not able to find anything what was close to Iptmon and working on latest Openwrt releases. I found Nlbwmon to be very nice tool but what I was missing was more detailed per hour statistics with nice charts.
This plugin assumes that you have Luci and luci-app-statistics installed. This plugin uses luci.jsonc lua library that should be bundled with Luci, if that is not the case you need to install this (details below). Another required library is collectd-mod-lua
Currently only IPv4 is supported, IPv6 support can be added later.
-
Make sure that you have
collectd-mod-luainstalled on you openwrt router if not execute:opkg update opkg install collectd-mod-lua -
Make sure that
luci-lib-jsoncis installed:opkg list-installed | grep luci-lib-jsonc [...] luci-lib-jsonc - git-22.097.61937-bc85ba5If it is not installed install this with:
opkg install luci-lib-jsonc -
Copy lua.conf to
collectd configdirectorycp lua.conf /etc/collectd/conf.d -
Copy nlbw2collectd.lua to
/usr/share/collectd-mod-lua/directorycp nlbw2collectd.lua /usr/share/collectd-mod-lua/ -
Restart collectd
/etc/init.d/collectd restart -
Login to Luci and go to Statistics->Graphs->Firewall. After about minute you should see your statistics.
Starting from Openwrt 22.03 release Iptmon stopped to work due to rpelacements of iptables with nftables. This plugin allows you to get the same set of statistics as Iptmon. To do this topu need to change two lines in the file nlbw2collectd.lua In order to do this find lines below:
local PLUGIN_INSTANCE_RX="mangle-nlbwmon_rx" -- change to "mangle-iptmon_rx" to have full compliance with iptmon
local PLUGIN_INSTANCE_TX="mangle-nlbwmon_tx" -- change to "mangle-iptmon_tx" to have full compliance with iptmon
and change them to:
local PLUGIN_INSTANCE_RX="mangle-iptmon_rx" -- we have full compliance with iptmon
local PLUGIN_INSTANCE_TX="mangle-iptmon_tx" -- we have full compliance with iptmon
Make sure that Iptmon is not installed since this plugin and Iptmon can not coexist.
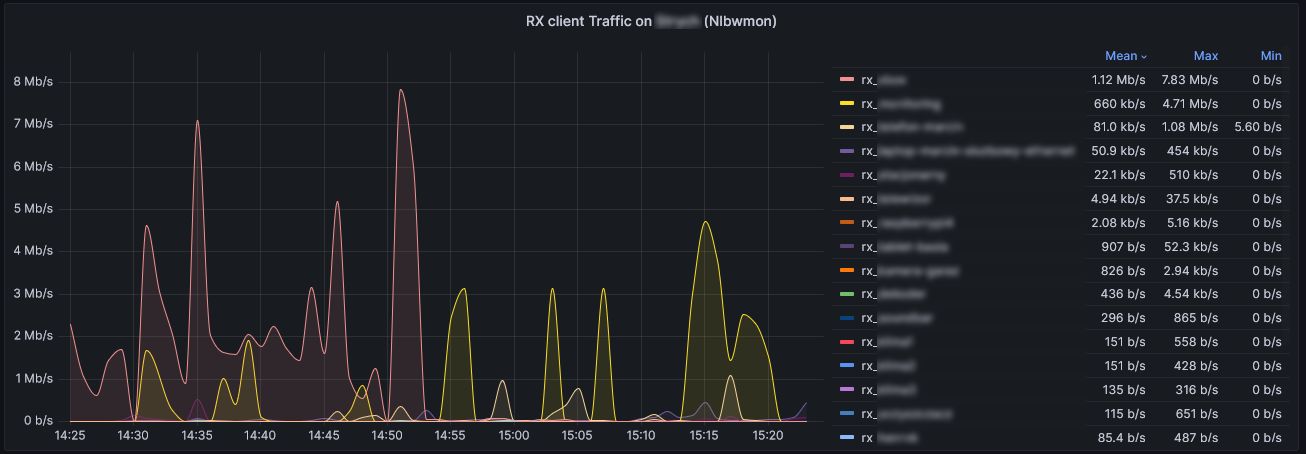
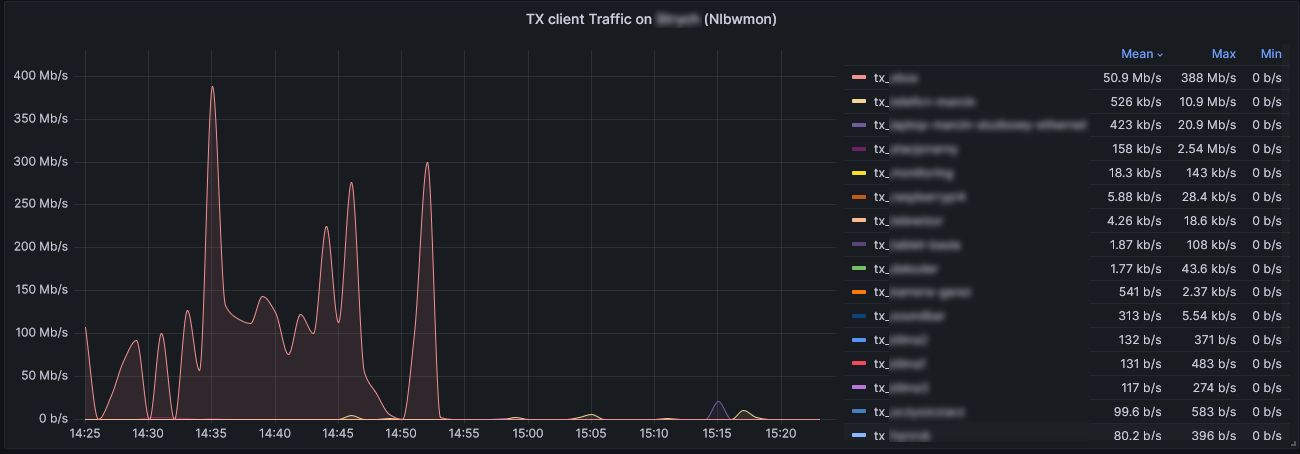
By exporting data to external Influxdb/Grafana server you can get more pleasant charts. Instruction can be found at Github
