This plugin provide time series / table data from Sumo Logic.
To install the beta version, copy the dist directory of this repository to the plugin directory of your Grafana installation, then restart Grafana. Environment-specific instructions follow.
To install the plugin on a Mac, with Grafana installed using Homebrew:
grafana-cli --pluginUrl https://github.com/mtanda/grafana-sumologic-datasource/releases/download/1.0.6/grafana-sumologic-datasource-1.0.6.zip plugins install mtanda-sumologic-datasource
brew services restart grafana
To install the plugin on Ubuntu Linux:
sudo grafana-cli --pluginUrl https://github.com/mtanda/grafana-sumologic-datasource/releases/download/1.0.6/grafana-sumologic-datasource-1.0.6.zip plugins install mtanda-sumologic-datasource
sudo /bin/systemctl restart grafana-server
Where path_to_plugins is the path to the plugins folder in your Grafana environment. The plugins folder is typically /var/lib/grafana/, but it may be different in your environment.
This plugin use Search Job API.
You need to create Access Keys. Please follow official document to create it.
https://help.sumologic.com/Manage/Security/Access-Keys
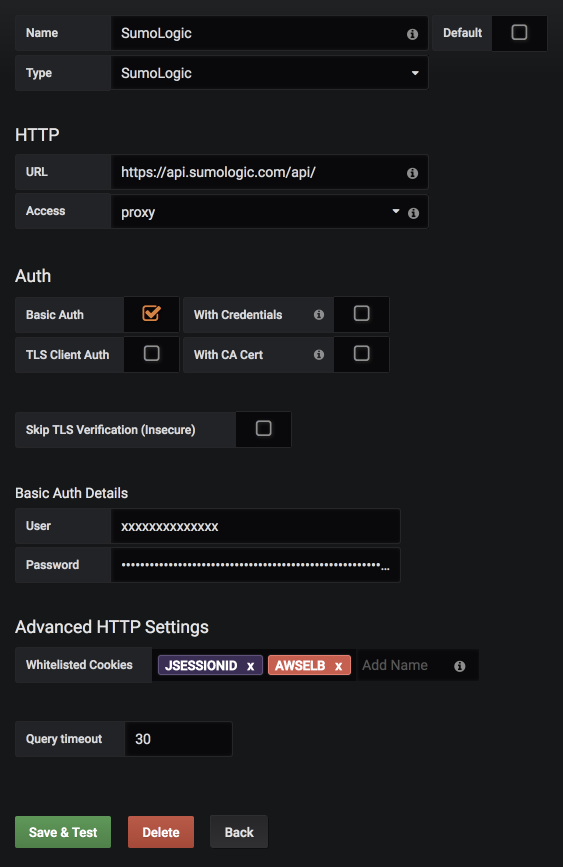
And then, please configure datasource like following.
| Name | Description |
|---|---|
| URL | Specify the API Endpoint for your environment. (See also this doc) |
| Access | Specify "proxy". |
| Basic Auth | Check this to specify Access Keys. |
| Basic Auth Details | Specify created Access Keys. |
| Whitelisted Cookies | To bypass Sumo Logic cookie to SumoLogic, please set "JSESSIONID,AWSELB" |
To use without saving Access Keys in Grafana backend, you need to disable datasource Basic Auth, and Grafana itself Basic Auth in ini file. When accessing datasoure proxy, auth dialog is appeared, input Access Keys, you can call API without saving Access Keys.
To test this datasource plugin, add Table panel and set following query.
* | count by _sourceCategory
Query for generating graph panel is a bit trickier (you have to use timeslice):
* | timeslice by $__interval
NOTE: $__interval is a grafana variable, it makes your time buckets adjust accordingly to the query timerange.
Of course you can use timeslice with a different argument if you wish.
- This plugin only work with proxy mode. (Sumo Logic API doesn't support CORS)
- This plugin doesn't support Metrics API.
- Initial release