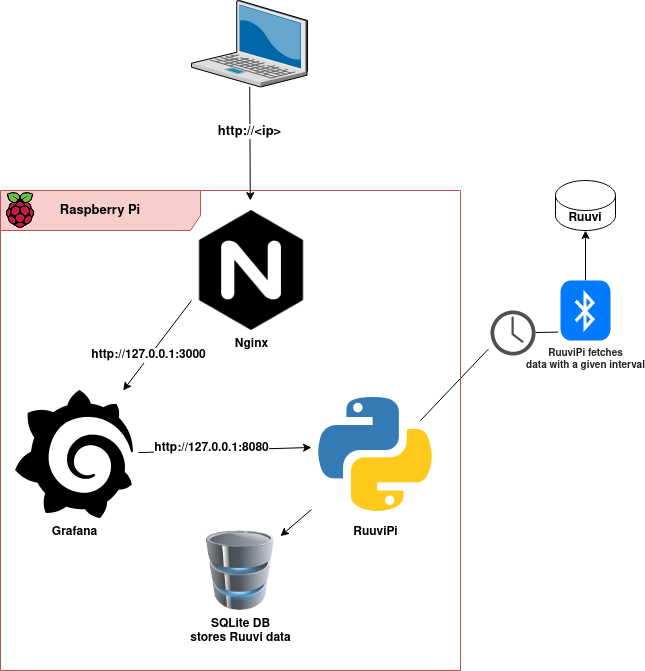
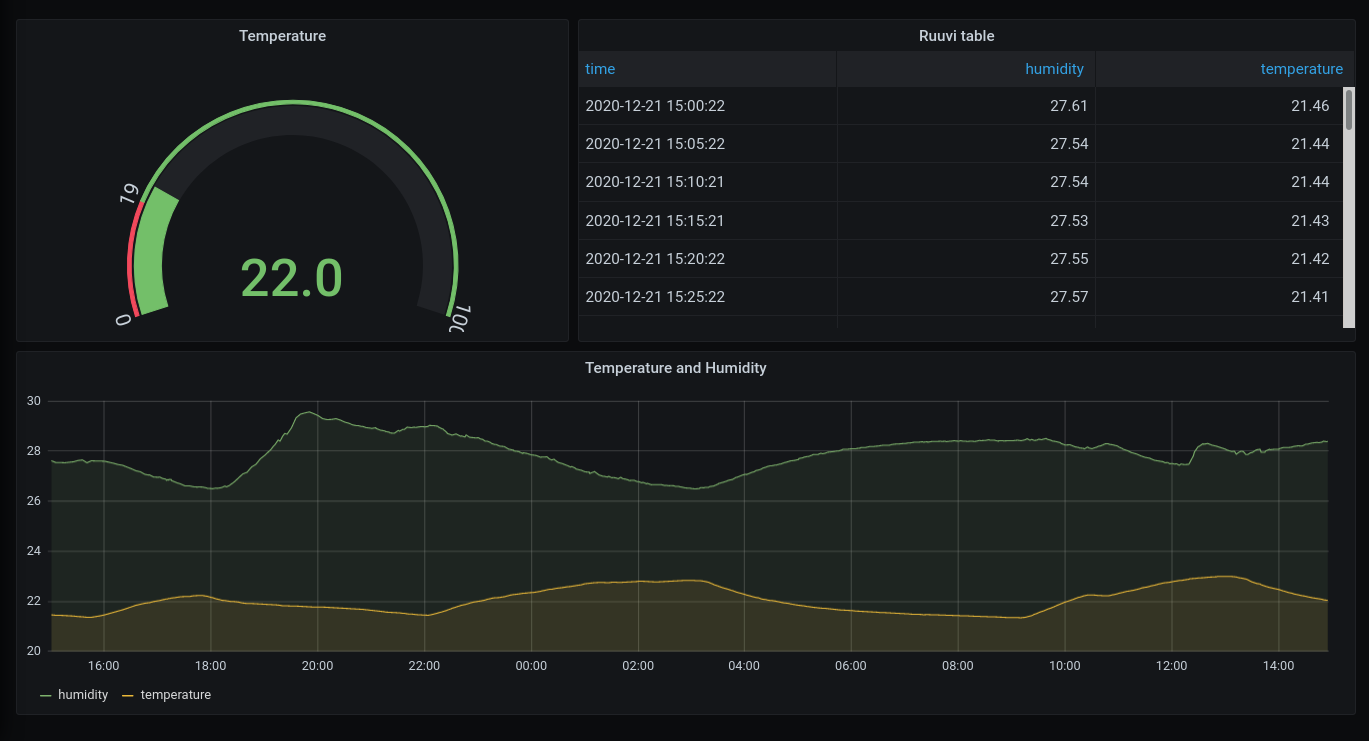
RuuviPi is a Flask based python application that provides JSON datasource to visualize data from Ruuvi tags in Grafana. It's designed to work with JSON plugin for Grafana.
The RuuviPi API polls Ruuvi tags using this library and stores the returned data in SQLite database. The poll interval can be specified in the app's configuration, and the polling is done in a seperate thread. The JSON plugin can then poll the API and it returns data for the requested timespan.
Below is a quick setup guide for the RuuviPi API. More detailed instructions can be found in here.
sudo apt install bluez bluez-hcidump python3-pip
pip3 install ruuvitag_sensor flask python-dateutil
Check the example configuration in src/instance/conf.py and set proper values for your environment.
Most importantly make sure that you set correct MAC addresses of your Ruuvi tag(s).
Configuration properties:
TAGSspecifies your ruuvi tags. Set your tag's MAC address as a value in both "text" and "value" fields. Use lowercase without colon like in the below example. You can add multiple dicts if you have multiple tags.
TAGS = [ { "text": "e4c7751d5230", "value": "e4c7751d5230"} ]
DATA_COLUMNSspecifies what data should be included in API responses. Options are time, data_format, humidity, temperature, pressure, acceleration, acceleration_x, acceleration_y, acceleration_z, tx_power, battery, movement_counter, measurement_sequence_number, and mac.
DATA_COLUMNS = ['time','temperature','humidity']
DATABASEspecifies path to SQLite database file. The file is created automatically if it doesn't exist.
DATABASE = "/home/pi/ruuvitag.db"
DATA_FETCH_DELAYspecifies how often the RuuviPi should poll Ruuvi tag(s) for sensor data and store the data in the database. The value is in seconds.
DATA_FETCH_DELAY = 300
LOG_FILEspecifies path to a log file. The app will write log events to console if this setting is not specified.
- Run development server
python3 ruuviDataSource.py
- Gunicorn
gunicorn --bind 127.0.0.1:8080 wsgi:app
GET /should return "OK" and 200 status code. (curl http://127.0.0.1:8080/)POST /searchshould return list of your tags in the same format that was specified in settings. (curl -X POST http://127.0.0.1:8080/search)POST /queryreturns sensor data in format that can be visualized in Grafana. An example to test this is below. This,however, doesn't include all the query parameters that Grafana includes. Change MAC address to match one of your tags and suitable from/to values to test the example.
curl -H "Content-Type: application/json" -X POST http://127.0.0.1:8080/query -d '{"range": {"from": "2020-12-22T06:13:41.884Z","to": "2020-12-22T12:13:41.885Z"},"targets": [{"target": "e4c7751d5230", "type": "table"}]}'
Install Grafana and JSON plugin. Configure RuuviPi's URL as a new JSON data source and specify it as a data source for a panel with table format.

