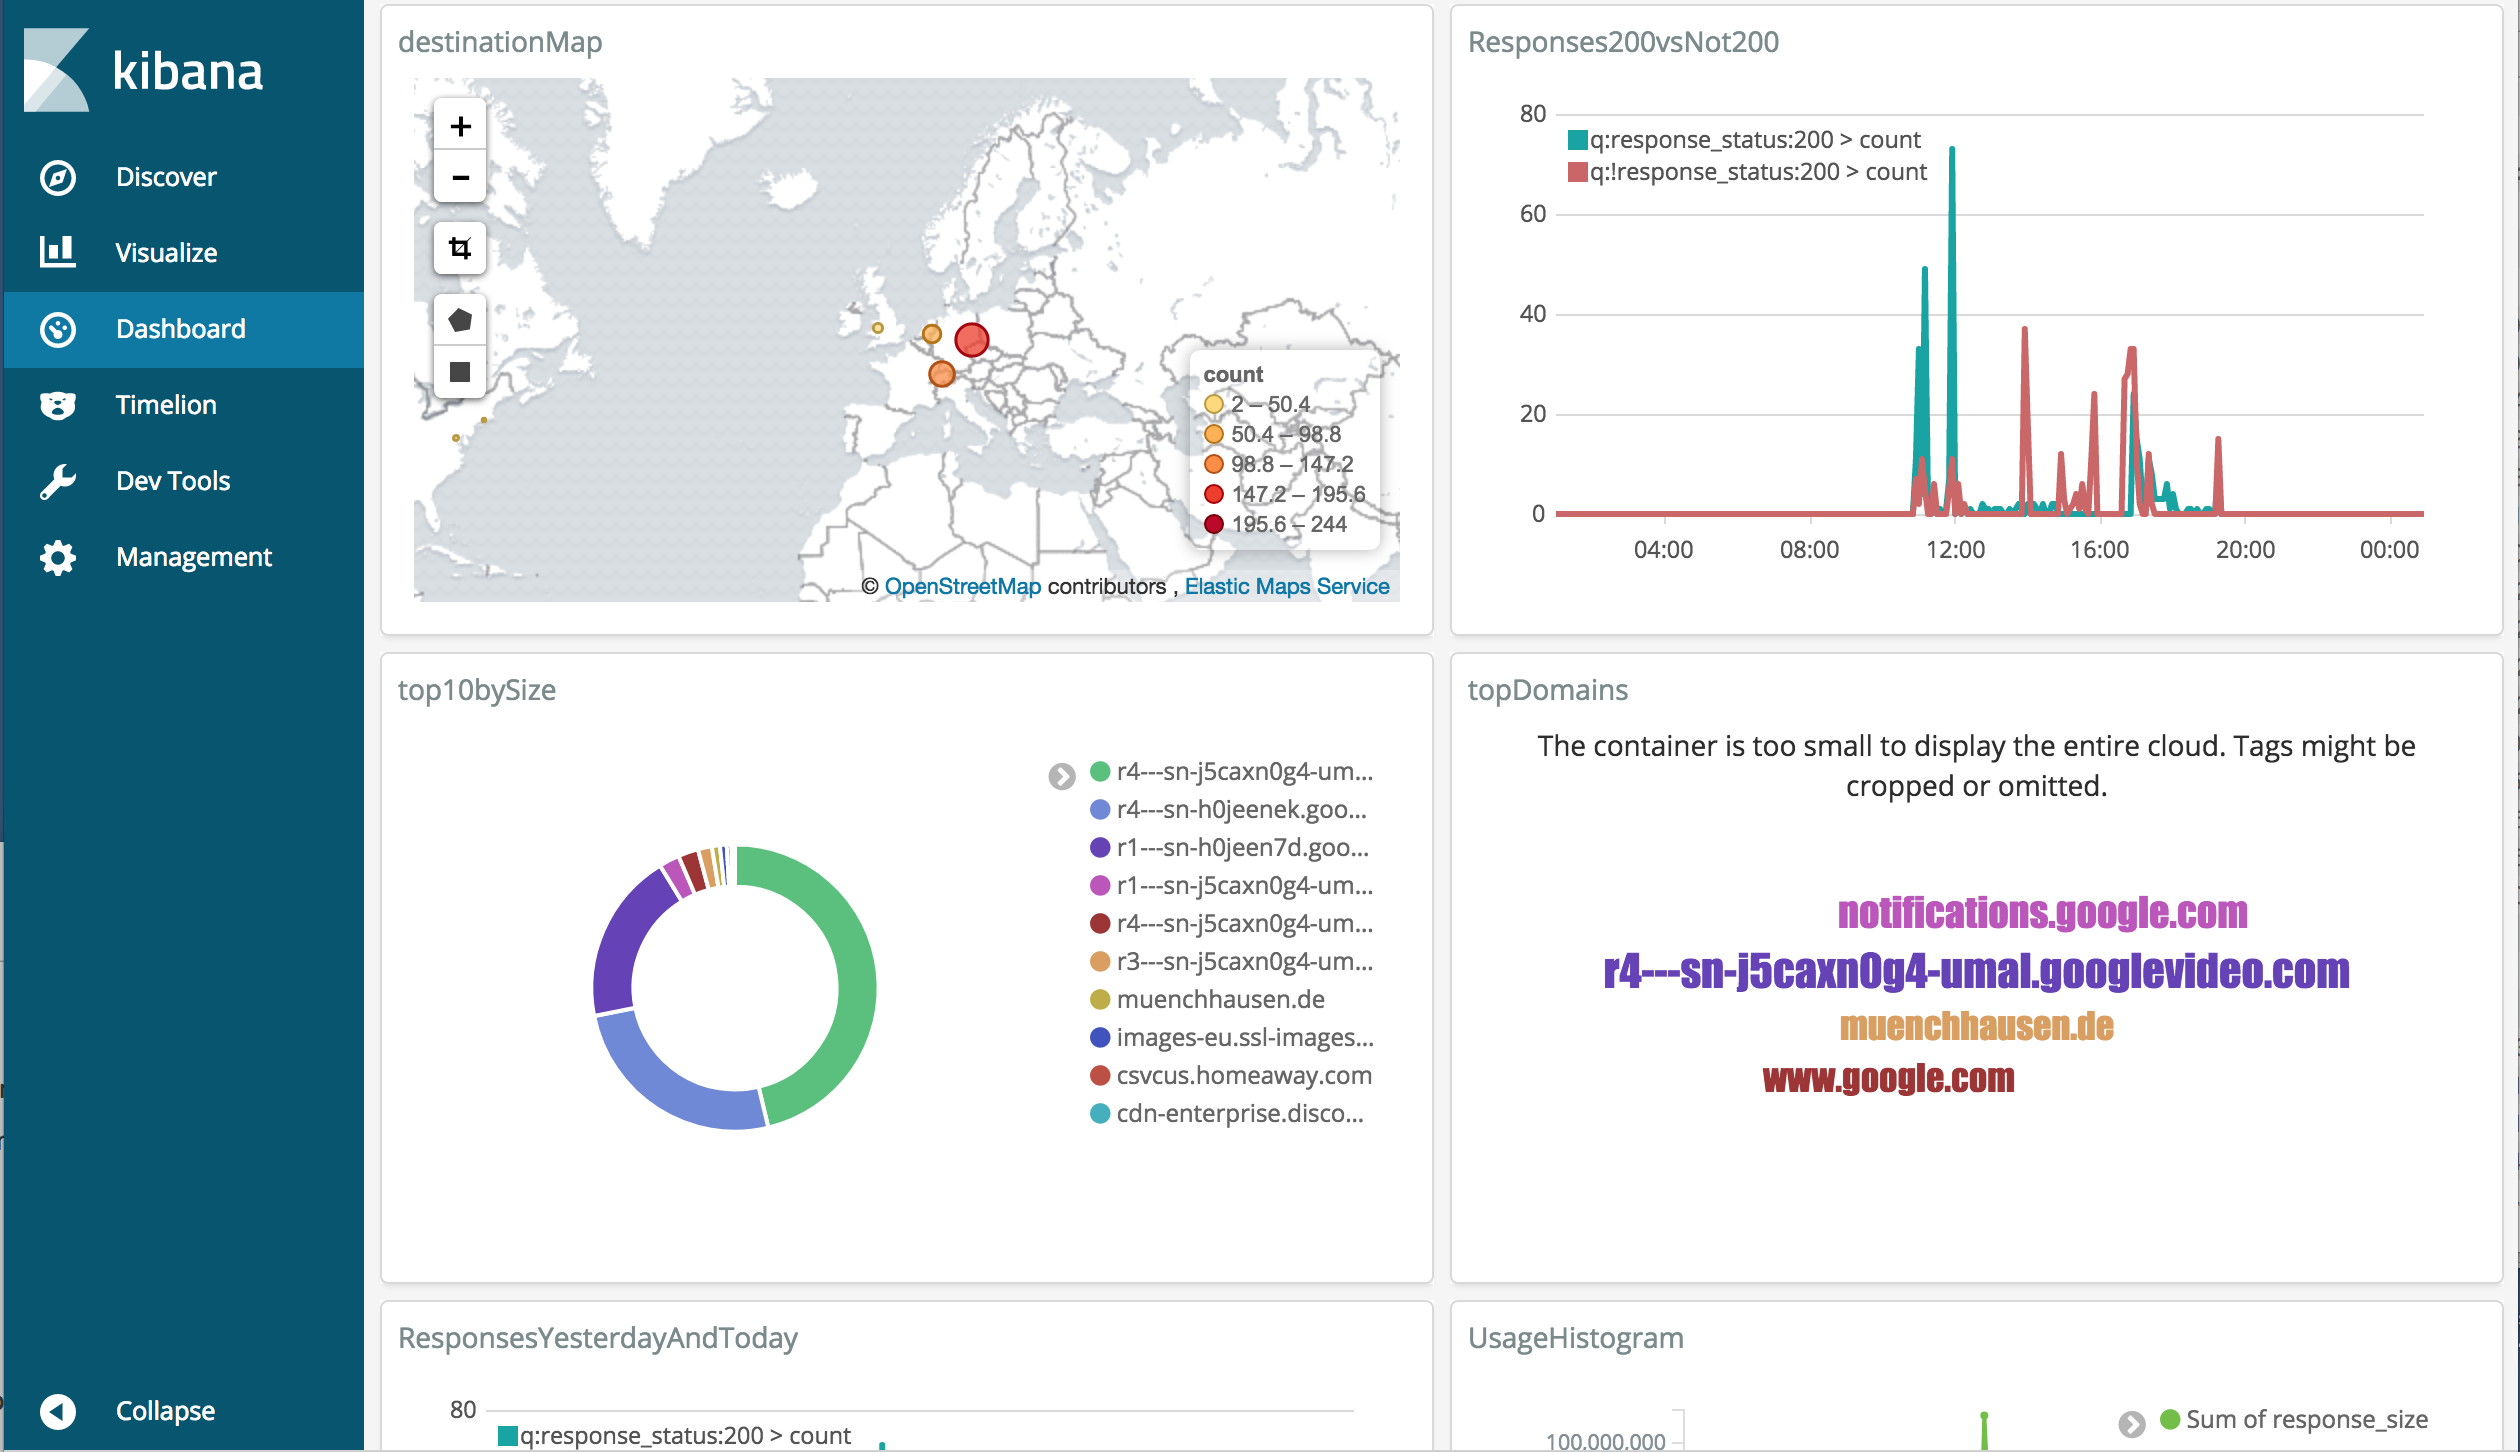
this repository combines the Docker Containers muenchhausen/docker-squidguard and sebp/elk to visualize all proxy requests with kibana.
We are following the Docker way: We combine containers with single responsibility and reuse available Containers. To collect log files it is mostly recommended to run a dedicated filebeat Container that accesses log volumnes and not to install filebeat everywhere.
These containers simply work, just do these steps:
git clone https://github.com/muenchhausen/docker-squidguard-elk.git
cd docker-squidguard-elk
vi docker-compose.yml
cd myconfig
vi block.html
vi squidGuard.conf
vi wpat.dat
cd ..

sudo su -
docker-compose stop && docker-compose rm -f && docker-compose build && docker-compose up --force-recreate
First use squidguard, so we get some log data for Elastic Stack. Either configure your squidguard proxy in your browser or run e.g.
curl --proxy http://192.168.99.100:3128 http://muenchhausen.de
curl --proxy http://192.168.99.100:3128 http://www.google.com
...
Then open kibana in the Browser e.g. http://192.168.99.100:5601/
Create the Elastic Search index with one click: http://192.168.99.100:5601/app/kibana#/management/kibana/indices/
Check if you see incomming log entries (one entry should have been created during startup for testing): http://192.168.99.100:5601/app/kibana#/discover
Import sample kibana config kibana-sample-export.json: http://192.168.99.100:5601/app/kibana#/management/kibana/objects
Or create your own personal visualizations e.g. aggregate the count of requests splitted/grouped by dst_host.raw http://192.168.99.100:5601/app/kibana#/visualize/step/1
This product includes GeoLite2 data created by MaxMind, available from http://www.maxmind.com.
