In this tutorial, we will guide you through the process of benchmarking storage for a specific workload in your OpenShift cluster. Benchmarking in this context aims to determine the Input/Output (IO) sizes that are read and written to disk by a particular workload. This information is valuable for estimating the scalability limits of the workload without the need to deploy it at scale. We will focus on the following key aspects:
- Installation of the Prometheus Exporter for Workload Benchmarking
- Ensuring Monitoring for the Workload
- Installation of Grafana to Visualize Workload Metrics
- Backup of Gathered Workload Information via Prometheus Backup
By the end of this tutorial, you will have the knowledge and tools to perform targeted storage benchmarking for a specific workload within your OpenShift environment.
To benchmark storage for your specific workload, you need to install a Prometheus Exporter tailored to this purpose. Follow these steps:
-
Login to OpenShift: Access your OpenShift cluster using your preferred authentication method on the commandline. This is usually done using
oc login. You can verify that you are logged in withoc whoami. -
Deploy the eBPF Prometheus Exporter: Use this cluster's YAML manifest to deploy the eBPF Prometheus Exporter. It will create a new namespace
ebpf-exporterand deploy everything in there. To apply execute this:oc apply -f https://github.com/mulbc/k8s-storage-profile/raw/main/supporting-files/ebpf-exporter.yaml -
Verify Deployment: Check the status of deployment with:
oc get daemonset,service --namespace ebpf-exporter
The output should look similar to this:
NAME                           DESIRED   CURRENT   READY   UP-TO-DATE   AVAILABLE   NODE SELECTOR   AGE
daemonset.apps/ebpf-exporter   6         6         6       6            6           <none>          60s

NAME                    TYPE        CLUSTER-IP      EXTERNAL-IP   PORT(S)    AGE
service/ebpf-exporter   ClusterIP   10.111.16.136   <none>        9435/TCP   59s
The desired, current, ready, up-to-date and available counts will depend on the amount of nodes in the cluster. In the above example we had three worker and three control-plane nodes (six nodes in total) in the cluster.
Before diving into benchmarking, it's crucial to verify that the monitoring setup is functioning properly for your specific workload:
-
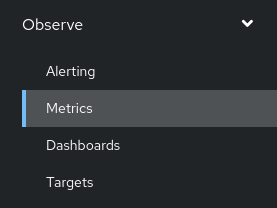
Go to OpenShift Web UI Metrics: Go to your OpenShift Web UI and navigate to Observe --> Metrics in the left Navigation Bar.
-
Select ebpf metrics: Start typing "ebpf in the
Expressioninput field. The new metrics should appear immediately and it should look like this: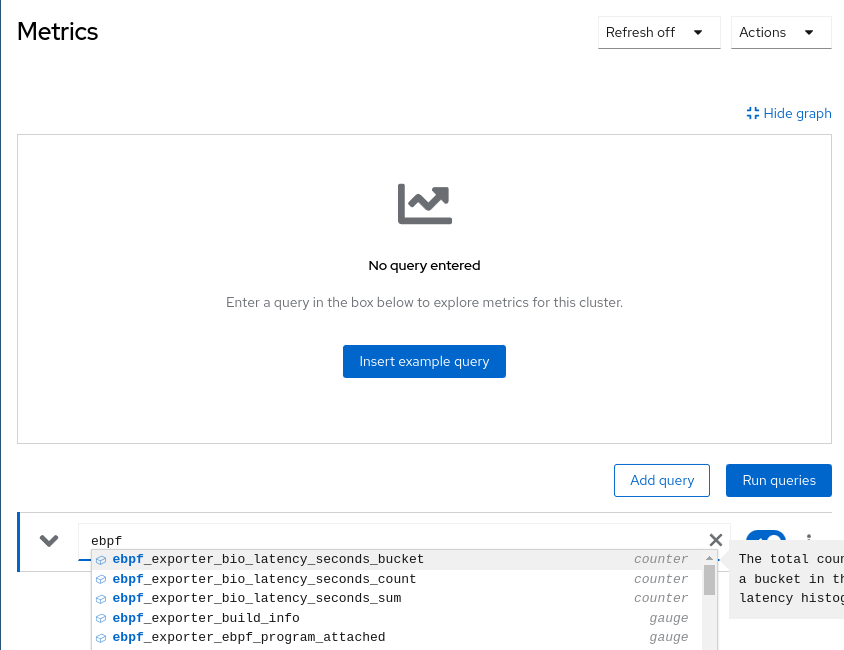
This means everything is working well and you can proceed to the next chapter.
If no suggestions appear or metrics starting with
ebpf_exporterare not in the list, something is wrong. Check if the Pods are running, if the service exists and that your Prometheus installation in OpenShift is healthy.


To visualize and analyze the storage metrics gathered from your workload, you can use Grafana. Follow these steps:
-
Install the Grafana Operator: If the Grafana Operator is not already installed, use OpenShift's OperatorHub to install it:
- Search the Operator in OperatorHub
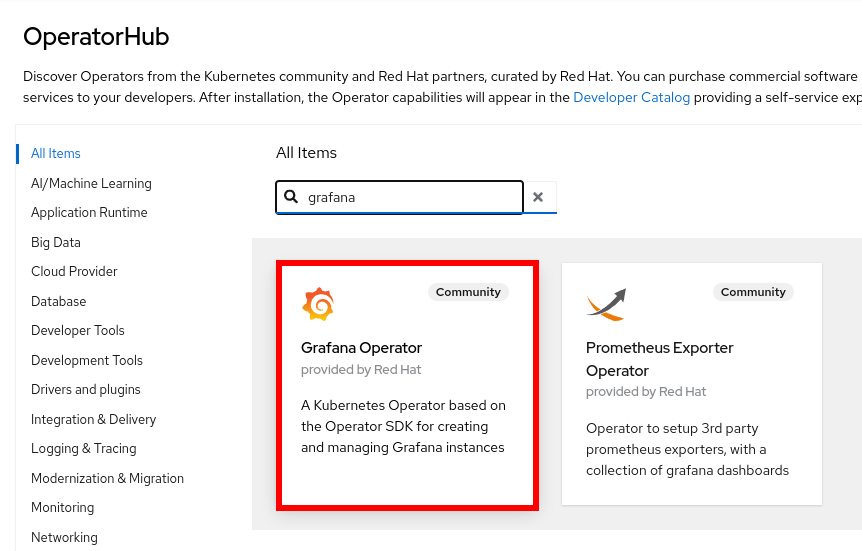
- Proceed to install
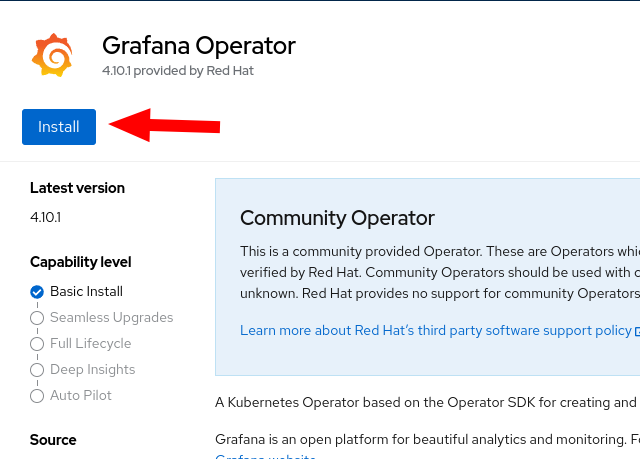
- Select v5, leave everything else and click install
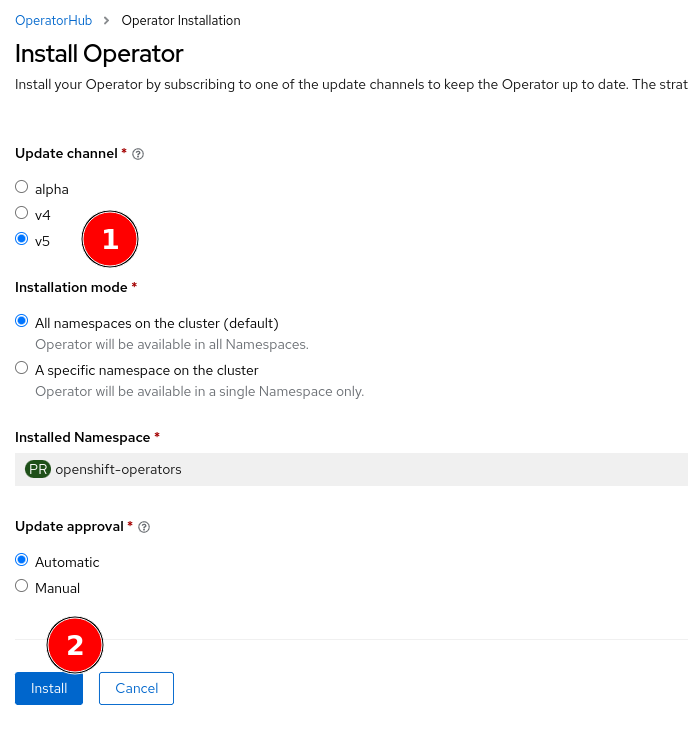
- Once finished, click on
View Operatorto proceed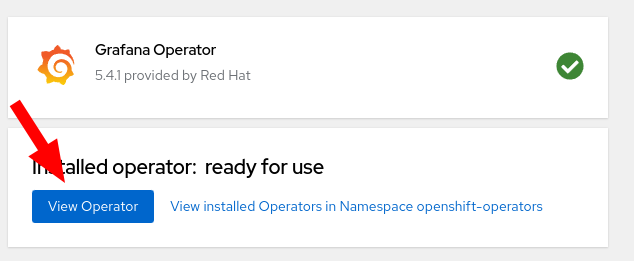
- Search the Operator in OperatorHub
-
Create a Grafana Instance for Your Workload: Create a Grafana instance to actually install Grafana in your cluster:
- Go to the Grafana tab
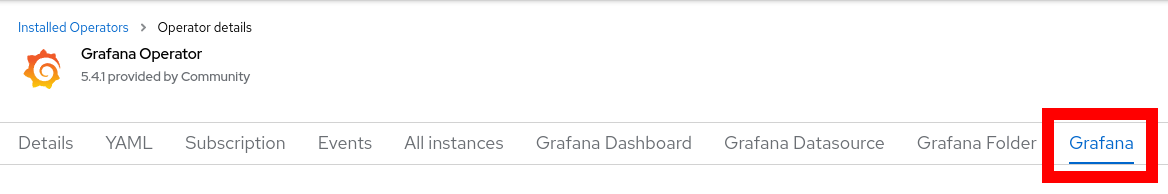
- Click on
Create Grafanaon the top right. - Select the YAML view, then set your desired
admin_passwordandadmin_user.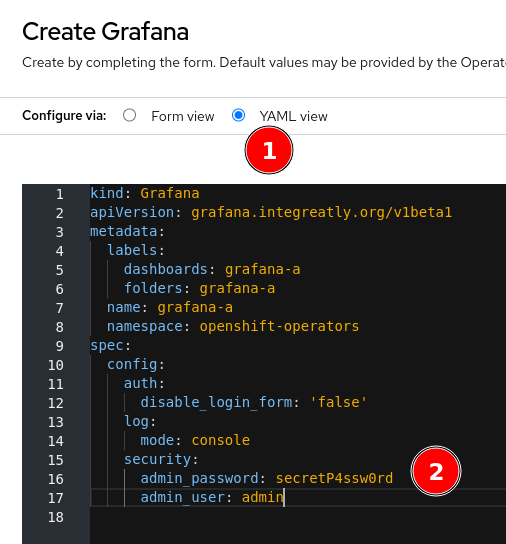
- Finish by clicking on
Createat the bottom.
- Go to the Grafana tab
-
Connect Grafana to OpenShift Monitoring: Grafana needs special access permissions to access the cluster metrics:
- Allow the Grafana Service Account to view the system metrics:
oc adm policy add-cluster-role-to-user cluster-monitoring-view -z grafana-a-sa
- Get a token for Grafana with these access levels:
export BEARER_TOKEN="$(oc create token grafana-a-sa --duration=8760h -n openshift-operators )"
- If the above fails, make sure to update your local
ocbinary and that you are using OpenShift 4.11 and above! - Create the Grafana Data Source like this:
cat <<EOF | oc create -f -
apiVersion: grafana.integreatly.org/v1beta1
kind: GrafanaDatasource
metadata:
    name: grafanadatasource-cluster
    namespace: openshift-operators
spec:
    datasource:
        jsonData:
        timeInterval: 5s
        tlsSkipVerify: true
        httpHeaderName1: 'Authorization'
        access: proxy
        editable: true
        isDefault: true
        name: Prometheus
        secureJsonData:
            httpHeaderValue1: 'Bearer ${BEARER_TOKEN}'
        type: prometheus
        url: 'https://thanos-querier.openshift-monitoring.svc.cluster.local:9091'
    instanceSelector:
        matchLabels:
        dashboards: grafana-a
EOF
- Allow the Grafana Service Account to view the system metrics:
-
Access the Grafana Dashboard: Access the Grafana dashboard from your web browser and configure it to display the workload-specific metrics collected by Prometheus.
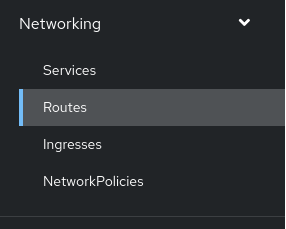
- Go to Networking --> Routes in the OpenShift Web UI to create a route for your new Grafana instance
- Click on
Create Routeon the top right - Configure your new route:
- Make sure you are in the
openshift-operatorsnamespace - Use a name for the route that corresponds with what you are trying to do
- Select the Service of your new Grafana instance
- Select Port 3000 of your Grafana instance
- Finish by clicking on
Createat the bottom.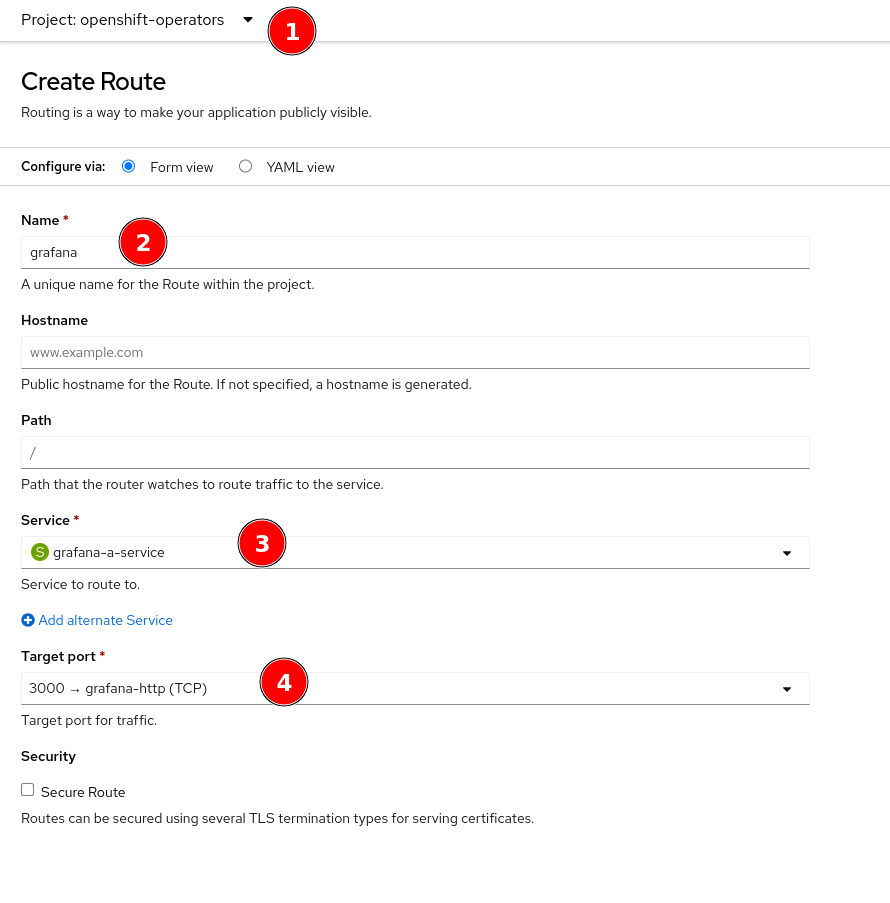
- Make sure you are in the
- You will now see your new Route, including the URL to your new Grafana instance.
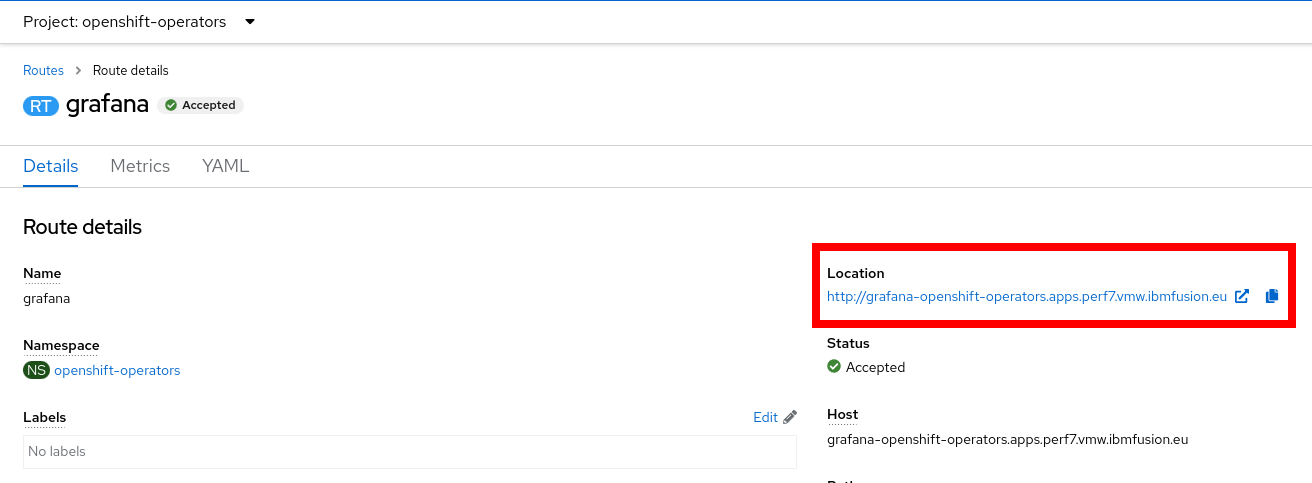 Be aware that our route is
 http://and your browser might try to forward you tohttps://, which will not work!
- Go to Networking --> Routes in the OpenShift Web UI to create a route for your new Grafana instance
-
Install the eBPF dashboard In order to make sense of our new histogram metrics, we need to use a custom Grafana Dashboard. This repository contains this Dashboard in JSON format for easy import:
- Apply the YAML manifest in this repository to install the Dashboard:
oc apply -f https://github.com/mulbc/k8s-storage-profile/raw/main/supporting-files/grafana-dashboard.yaml
- You should soon see the new eBPF dashboard in the openshift-operators folder. It will start populating with data over time
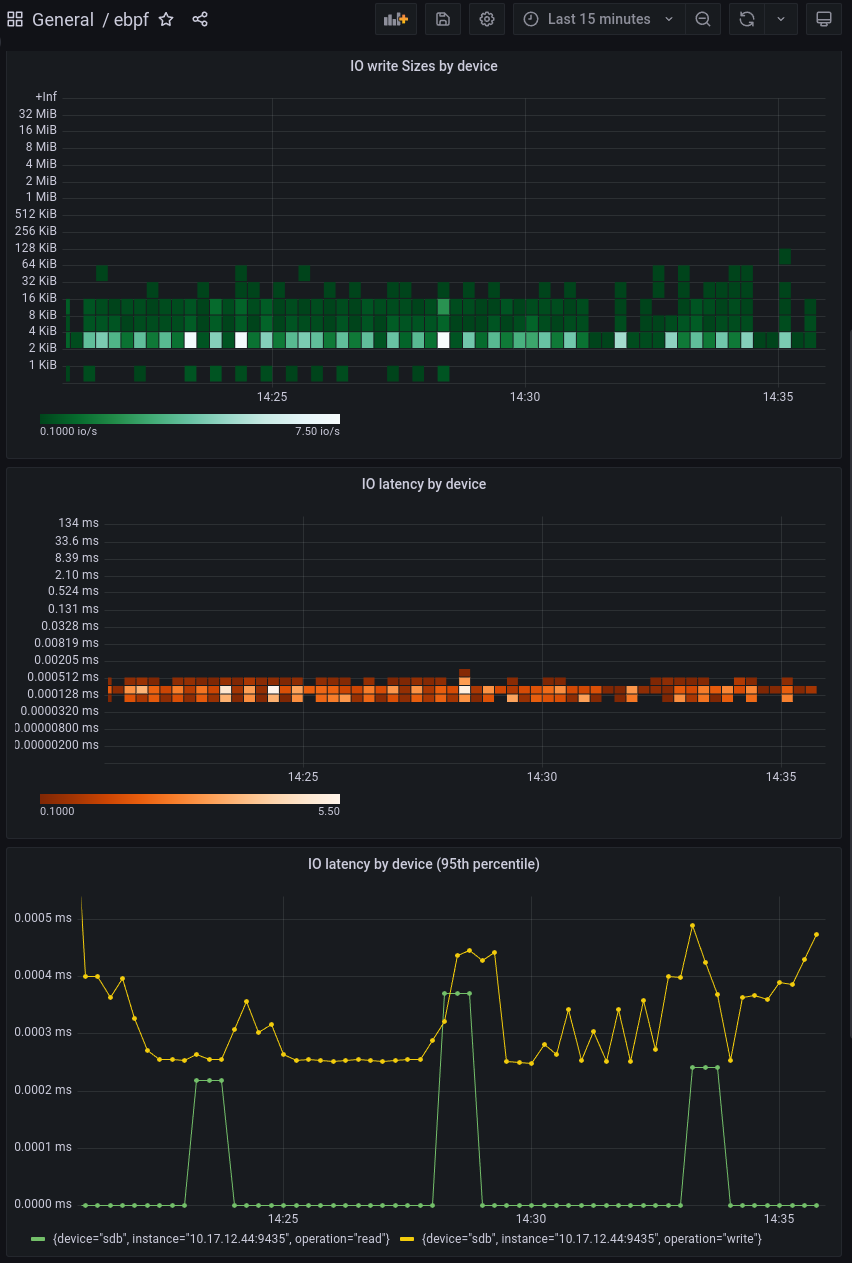
- Apply the YAML manifest in this repository to install the Dashboard:


TODO