We implemented an LSTM RNN to predict an individual company's future stock prices. Our features are:
- the past prices of the stock
- sentiment analysis on scraped Reuters headlines regarding the company
- economic indicators for general market health
- sentiment analysis on scraped top-25 Reddit headlines for general market health
We pass the features to an LSTM RNN to train future stock price prediction. Following training, our model can predict future stock prices with high accuracy and attains high returns on investment while investing as an agent.
Our model StockModel() is a class in lstm.py. We have two demos of the model's predictions on the Apple stock (AAPL) in the demos/ directory. The Jupyter notebook is a standalone working demo of the model on AAPL, with outputs preprinted in-line for easy viewing. The same outputs can also be produced by running python PredictionDemo_AAPL.py. Note that we have not yet finished tuning hyperparameters on other stocks besides AAPL.
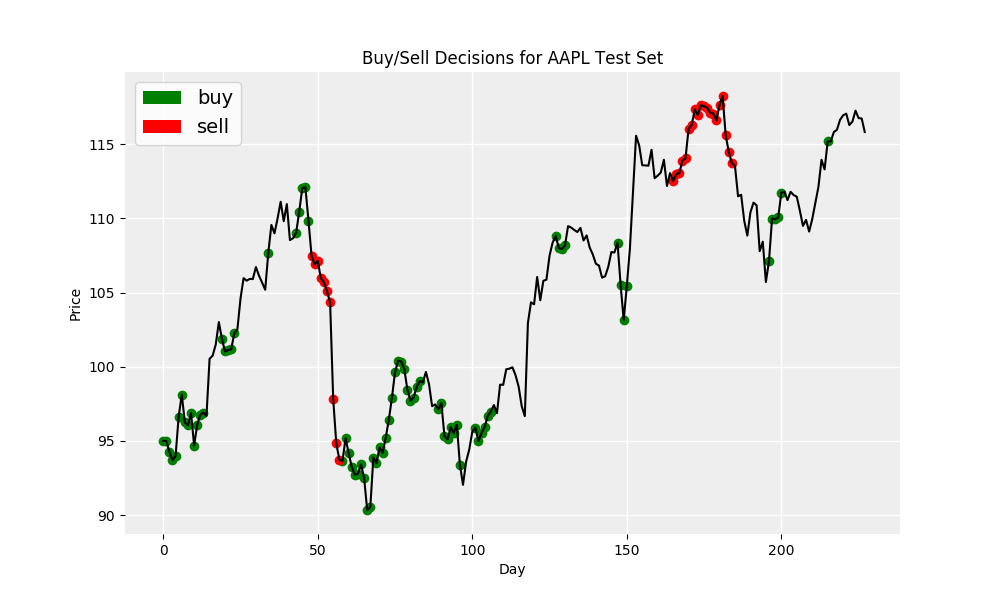
Our LSTM RNN model learns to "buy-low sell-high":

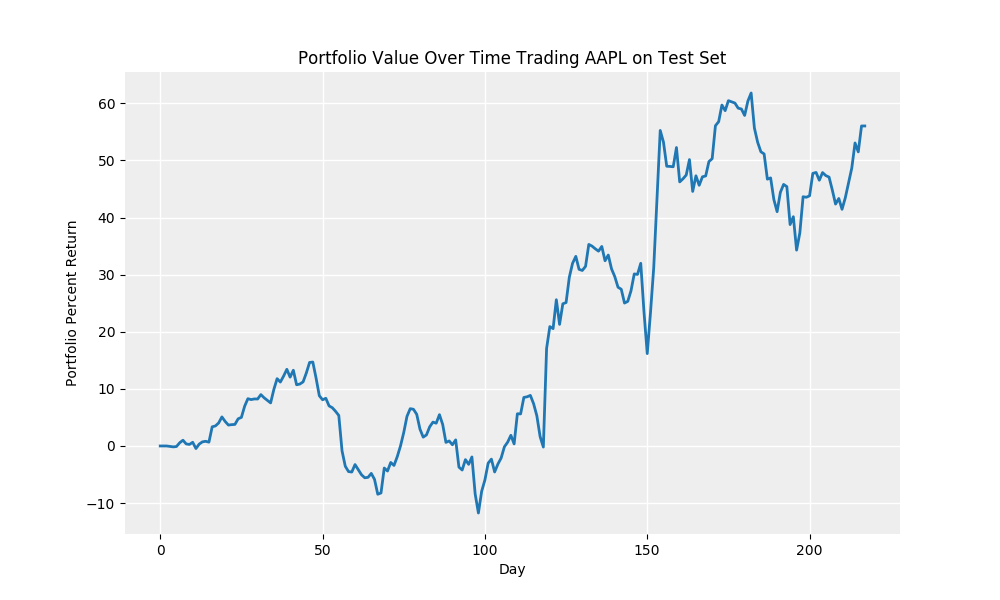
Our LSTM RNN model achieves significant return on investment in our test set (2016 calendar year):

To quickly get a functional implementation of our model, follow the demos/PredictionDemo_AAPL.py skeleton by running:
from lstm import StockModel

aapl_model = StockModel('AAPL')
aapl_model.loadStock()
model, history = aapl_model.train()
rmse = aapl_model.validate(model)

# perform downstream analyses and prediction on test set using keras modeldata/: directory containing scraped and sentiment-analyzed data through 2016 for AAPL, AMZN, FB, GOOG, TSLAdemos/: directory containing a jupyter notebook with an LSTM RNN model for AAPL (with output preprinted for easy viewing) and a python file to generate the notebook's same figures using theStockModel()class fromlstm.pyfigures/: directory containing plots generated frommain.pyandmodels/momentum.pyhyperparameters/: directory containinghyperparameters/tuning.pyfile to loop through hyperparameters and measure validation set rmse; hyperparameters/curves/ directory with hyperparameter optimization curves produced fromhyperparameters/tuning.pymodels/: directory containing saved keras model outputs as well as a momentum investing agent model comparison (inherits from theStockModel()class fromlstm.py), which buys if the stock price went up that day and sells otherwisescrape/: jupyter notebooks and csv output from reddit and reuters headline scrapinghelpers.py: some python helper functions, including plotting and date manipulationlstm.py: defines theStockModel()class, including training and testing methods (see below for full description of methods and attributes)main.py: python file to loop through stock tickers, trainStockModel()classes fromlstm.py, and save figures
-
__init__(self, ticker, stock_file = 'data/stock/prices-split-adjusted.csv', news_directory = 'data/news/', econ_file = 'data/market/economic_indicators.csv', reddit_file = 'data/market/reddit_sentiments.csv')Parameters
- ticker : string for company ticker, i.e. 'AAPL' (required)
- stock_file : string for location of stock prices csv; must have dates in first column, 'symbol' second column, and 'close' column (default: 'data/stock/prices-split-adjusted.csv')
- news_directory : string for location of directory for news sentiment analysis; must have csv's with stock names (i.e. 'AAPL.csv') with dates in first column and sentiment analysis features in others (default: 'data/news/')
- econ_file : string for location of economic metrics csv; must have dates in first column, economic indicators in others (default: 'data/market/economic_indicators.csv')
- reddit_file : string for location of reddit sentiment analysis csv; must have dates in first column, reddit headline sentiment analysis in others (default: 'data/market/reddit_sentiments.csv')
-
loadStock(self, lookback=25, validation_split=True)Load stock data from csv's into one dataframe, normalize data, and split into training/validation/test sets
Parameters
- lookback : integer for number of days in past to look when predicting a future day (default: 25)
- validation_split : bool for whether to split and include a validation set (default: True)
-
train(self, lstm_dim1=128, lstm_dim2=128, dropout=0.2, dense_dim1=None, epochs=200)Train model on loaded stock data, must call
loadStock()before training, returns model and loss historyParameters
- lstm_dim1 : int for output size of first lstm layer (default: 128)
- lstm_dim2 : int for output size of second lstm layer (default: 128)
- dropout : float for dropout percent, randomly choose this percent of output units and set to zero (default: 0.2)
- dense_dim1 : int for output size of first densely connected NN layer, None to remove this layer (default: None)
- epochs : int for number of epochs to train with (default: 200)
Returns
- model : keras model after compilation and training
- history : training and validation losses during training by epoch
-
validate(self, model)Validate model on validation set, returns rmse
Parameters
- model : keras model (required) Returns
- rmse : validation set rmse
-
plotOneDayCurve(self, model, filename='onedaycurve0.png')Plot prediction curve on test set with one day lookahead, save to
figures/Parameters
- model : keras model (required)
- filename : output file name (default: 'onedaycurve0.png')
-
plotFutureCurves(self, model, days_topredict=30, filename='futurecurves0.png')Plot prediction curves on test set with n-day lookahead, save to
figures/Parameters
- model : keras model
- days_topredict : int for number of days to predict forward (default: 30)
- filename : output file name (default: 'futurecurves0.png')
-
plotBuySellPoints(self, model, return_threshold=0.5, days_topredict=30, filename='buysell0.png')Plot test set stock prices overlayed with dots for predicted buying/selling points, save to
figures/Parameters
- model : keras model (required)
- return_threshold : float for predicted return threshold after
days_topredictto decide buy/sell (default: 0.5) - days_topredict : int for number of days to predict forward when calculated projected return (default: 30)
- filename : output file name (default: 'buysell0.png')
-
plotPortfolioReturn(self, model, initial_cash=10000, per_trade_value=500, return_threshold=0.5, days_topredict=30, filename='portfolio0.png')Plot percent return over time on test set while trading according to model, save to
figures/Parameters
- model : keras model (required)
- initial_cash : float for initial cash willing to invest in this stock's model (default: 10000)
- per_trade_value : float for approximate constant value of each trade (default: 500)
- return_threshold : float for predicted return threshold after
days_topredictto decide buy/sell (default: 0.5) - days_topredict : int for number of days to predict forward when calculated projected return (default: 30)
- filename : output file name (default: 'portfolio0.png')
StockModel().ticker: string for ticker symbol of model from initialization, i.e. 'AAPL'StockModel().X_train: training set features following a call fromStockModel().loadStock()StockModel().X_valid: validation set features following a call fromStockModel().loadStock(validation_split=True)StockModel().X_test: test set features following a call fromStockModel().loadStock()StockModel().y_train: training set next-day prices following a call fromStockModel().loadStock()StockModel().y_valid: validation set next-day prices following a call fromStockModel().loadStock(validation_split=True)StockModel().y_test: test set next-day prices following a call fromStockModel().loadStock()