Features | Solution Architecture | The Solution | Quick Start | Author | Credits | Failures | Presentation
Highly Available Elasticsearch solution is designed to help out the team to execute (near) real-time queries and visualize the free form reviews that the customers fill out after each delivery.
The Solution Architecture section contains detailed information about the configured and unconfigured values and describes their background. So it is not necessary to read that section to deploy the Highly Available Elasticsearch solution.
You can check out The Solution section to flick through the configuration values and the reasons for the configuration or just jump to the Quick Start section to deploy the solution.
I can say that I have spent more than 25 hours writing this document including researches, 2 hours for trying the solution, and a couple of hours thinking about the ways to increase the resilience. Also, I have spent some time on my failures too.
• Elasticsearch cluster in Kubernetes cluster: At this project elasticsearch cluster is deployed in the kubernetes cluster with the help of ECK, to simplify and speed up the deployment and updates. It is only needed a kubeconfig file to use the remaining k8s cluster.
• Highly available: The elasticsearch cluster is configured carefully to ensure it has high availability and the cluster is resilient to single-node failures. Also created automated snapshots to ensure the data may be restored.
• Same roles: The roles assigned to each of the elasticsearch nodes are all identical as the cluster is deployed with a single NodeSet definition with a count of 3.
• Downloadable: The solution can be downloaded by cloning the project or downloading the zip file under releases.
• Well documented: Whole architecture and details of the solution are documented in this README-driven project. This documentation which simplifies the complicated things surely helps understanding Elasticsearch, and by that, it helps to design a resilient cluster.
• Deployed via Kustomize: Kustomize is used to manage kubernetes workloads and to generate an output file which will be used to deploy highly available elasticsearch on the kubernetes cluster.
• Easy appliable: When all of the steps are completed successfully, an elasticsearch cluster will be deployed and ready.
Elasticsearch is a distributed, search and analytics engine that gives the near real-time search experience and analysis of data.
It is fast, distributed, and capable of handling the volume and free-form nature of data, scalable and resilient.
An elasticsearch cluster can be spawn quickly to use on AWS, but the optimization of the cluster will be crucial to improve the speed and sustainability. There are gigabytes of data coming in all the time and the data has to be easily accessible and the cluster has to be resilient. Elasticsearch works even with an unoptimized configuration, but as there are more data, there will be more errors to encounter.
It is not that easy to run an elasticsearch cluster in production. It is always better to take time while building your cluster. You need to understand what your requirements are and what you want before building your cluster. And keep tuning the configuration as you encounter errors until the cluster will become stable.
This solution will focus on the resilience of the elasticsearch cluster and the design.
Sometimes the cluster may experience hardware failure or a power loss. The cluster will be resilient to the loss of any node as long as:
- The cluster health status is green.
- There are at least two data nodes.
- Every index that is not a searchable snapshot index has at least one replica of each shard, in addition to the primary.
- The cluster has at least three master-eligible nodes, as long as at least two of these nodes are not voting-only master-eligible nodes.
- Clients are configured to send their requests to a load balancer that balances the requests across an appropriate set of nodes.
Elasticsearch offers some features to keep the cluster highly available.
-
Cross Cluster Replication: It lets you replicate the index and the data across remote follower clusters which may be in a different data zone from the leader cluster so that search requests can be still handled during the datacenter outage:
- In the uni-directional configuration, there is one cluster to contain only leader indices and the other cluster to contain only follower indices. It can be applied the architectures:
- Single disaster recovery datacenter
- Multiple disaster recovery datacenters
- Chained replication
- In the bi-directional configuration, each cluster contains both leader and follower indices.
- Bi-directional replication
- Please note that CCR is not covered in this solution as high availability should be provided using only one cluster.
- In the uni-directional configuration, there is one cluster to contain only leader indices and the other cluster to contain only follower indices. It can be applied the architectures:
-
Take regular snapshots: So that you can restore a fresh copy of your data.
- The snapshot creation and retention process could be automated using Snapshot Lifecycle Management (SLM).
- If multiple SLM policies are defined to create snapshots at different time intervals, it lets you restore data from a wider range.
- The snapshots can be stored in file system locations or in custom repositories like S3, Azure & Google Cloud Storage. See this link for details.
- Periodic snapshots can be taken with also a CronJob
-
Design for resilience: The main step of high availability is the design for resilience as an Elasticsearch cluster can continue operations as normal if some of its nodes or components are unavailable when there are enough well-connected nodes with a proper design.
- One node clusters: A single node cluster cannot be resilient as there are no replicas. It is needed to override the
number_of_replicasvalue as 0 to ensure the cluster can report agreenstatus. A snapshot may be restored if the node fails. One-node clusters are not recommended to use in production. - Two-node clusters: A two-node cluster cannot be resilient. The master elections are majority-based, so one of the nodes should be configured as
node.master: falseto ensure it is master-ineligible as if both of the nodes were master-eligible the master election will fail. With this type of design, the cluster may tolerate the loss of the master-ineligible node. Also, a resilient load balancer should be configured to balance client requests across the nodes. - Three-node clusters: All three nodes can have the same roles in this scenario and as they all are master-eligible, the cluster will be resilient to the loss of any single node. Also, a resilient load balancer should be configured to balance client requests across the nodes.
- Clusters with more than three nodes: It is good practice to limit the number of master-eligible nodes to three, which will shorten the time of master elections. But as the cluster is larger, it is recommended to use dedicated nodes for each role to scale resources for each task independently. Also, you should avoid sending any client requests to the dedicated master-eligible nodes to overwhelm them with unnecessary extra work that could be handled by one of the other nodes.
- Multizone clusters: Resilience in larger clusters
- One node clusters: A single node cluster cannot be resilient as there are no replicas. It is needed to override the
The most-used node roles are:
master: Every cluster requires this role.dataordata_content&data_hot: This is required by every cluster.ingest: Required if stack monitoring & ingest pipelines are used.remote_cluster_client: Required if cross-cluster search/replication is used.transform: Required if fleet, elastic security or transforms used.ml: Required if using machine learning features, such as anomaly detection.xpack.ml.enabledmay be set asfalseto disable the machine learning API on the node.
In Elasticseach, the data is organized in indexes and each index is divided into shards that are distributed across multiple nodes.
Elasticsearch is based on Apache Lucene. Lucene Index is made of little segments of files located on your disk. Whenever you write, a new segment will be created. When a certain amount of segments is reached, they are all merged. Whenever you need to query your data, each segment is searched.
So shards are created when a new document needs to be indexed, then a unique id is being generated and the destination of the shard is calculated based on this id.
Once the shard has been delegated to a specific node, each write is sent to the node.
This method allows a reasonably smooth distribution of documents across all of your shards. This will distribute your documents pretty well across all of your shards so you can quickly query lots of documents.
Searches run on a single thread per shard, so searches across lots of shards will cause slow search speeds as different shards have to be queried to collect the information.
Also, each index and shard requires some memory and CPU resources. Usually, a small set of large shards uses fewer resources than many small shards.
Elasticsearch will balance shards automatically. When a node has been added or a node has failed, Elasticsearch rebalances the index's shards across the remaining nodes. The time to rebalance the cluster increases as the shard size increases.
Also, replication of the shards to other nodes ensures that you always have the data even if you lose some nodes.
So, the optimal shard size or count will be between these extreme values, usually. And the best way is to run benchmarks using near-real data and queries.
On the older versions of Elasticsearch, it was recommended to calculate the number and size of shards.
But now, with the newer versions, the best way to prevent oversharding and other shard-related issues is to create a sharding strategy to help you determine and maintain the optimal number of shards for your cluster while limiting the size of those shards.
And as there isn't any strategy that fits every cluster, a good sharding strategy must account for your infrastructure, use case, and performance expectations. Quantitative cluster sizing webinar explains the recommended methodology to create a sharding strategy.
When building the sharding strategy, consider what was explained detailly previously.
Kibana has the required tools to monitor elasticsearch, which should be used as different shard configurations are tested.
Don't forget to:
- Aim for shard sizes between 10GB and 50 GB: This is not a hard limit but it is the best size for logs and time-series data. If Index Lifecycle Management (ILM) is used, set
max_primary_shard_sizethreshold to50gbto avoid shards larger than 50GB. - Aim for 20 shards or fewer per GB of heap memory. Check the number of shards per node and check the current size of each node's heap, if you find they exceed more than 20 shards per GB, add another node.
- Prevent node hotspots, by updating
index.routing.allocation.total_shards_per_nodesetting. - Avoid unnecessary mapped fields, by using explicit mapping instead of dynamic mapping to avoid creating fields that consume disk and memory but are never used.
The storage mechanism for Elasticsearch data has to be configured to work on Kubernetes, as any Kubernetes storage option. It is recommended to use PersistentVolumes, by creating a VolumeClaimTemplate with the desired storage capacity and StorageClass to associate with the PersistentVolume.
There are two types of PersistentVolumes which are both handled the same way, but their performance differs:
- Network-attached PersistentVolumes which provides a huge benefit. When the host goes down or needs to be replaced, the Pod can simply be deleted. Kubernetes reschedules it automatically on a different host and reattaches the same volume, very quickly and without any human intervention.
- Local PersistentVolumes which provides a huge overhead. When the host goes down or needs to be replaced, the Pod cannot be scheduled on a different host. Once a Local PersistentVolume is bound to it, the Pod can only be scheduled on the same host. It remains in a
Pendingstate until the host is available, or until the PersistentVolumeClaim is manually deleted. So Local PersistentVolumes come with some operational overhead.
Operations of Local PersistentVolumes
- Host Maintenance: When a host is out of the Kubernetes cluster temporarily, it is common to the cordon, then drain it. Depending on the PodDisruptionBudget, the pods on that host will be deleted automatically. The pod will stay on
Pendingstate and cannot be scheduled again on the cordoned host till the host gets online. The next pod will be deleted automatically as soon as the Elasticsearch cluster health becomes green again. - Host Removal If a host has a failure or is permanently removed, its local data is likely lost. The pod will stay
Pendingand it cannot attach the PersistentVolume anymore. The schedule the pod on a different host, with an empty volume, you have to manually remove both the PersistentVolumeClaim and the Pod. Then a new pod will be created with a new PersistentVolumeClaim which is then matched with a PersistentVolume. Finally, Elasticsearch shard replication makes sure that data is recovered on the new instance.
volumeBindingMode: WaitForFirstConsumeredit is set to let the pod which is scheduled on a host access the existing PersistentVolume.
Reclaim Policy: PersistentVolumeClaims are deleted automatically by ECK when they are not needed anymore. As the PersistentVolume with existing data cannot be reused, it is recommended to Delete, as default, instead of Retain.
On the older versions of Elasticsearch, it was a must to override the JVM options as Elasticsearch was shipped with a default heap size of 1 GB.
But with the newer versions, it is not recommended to modify advanced settings as it will negatively impact performance and stability. By default, Elasticsearch automatically sets the JVM heap size based on the node's roles and total memory.
The heap size still can be overridden, by the following rules:
XmsandXmxshould be set to no more than 50% of the total available RAM. Where the total memory is defined as the amount of memory visible to the container if Elasticsearch is running in a container. Not the total system memory on the host.- Also ideally, they should be less than 26GB because that is the point at which object pointers are not zero-based anymore and it will drop the performance.
The heap size can be configured by defining the ES_JAVA_OPTS variable as -Xms8g -Xmx8g
Note: When running Elasticsearch on ECK, by default, ECK applies a memory resource limit of 2 GiB to the container. It's recommended to configure the resources in the manifest file.
Elasticsearch uses memory mapping (mmap) by default. The default values for virtual address space on Linux distros are too low for Elasticsearch to work properly, and that may lead to out-of-memory exceptions. For production, it is strongly recommended to increase the vm.max_map_count setting of kernel to 262144.
There are two options to run Elasticsearch with custom configuration files and specific plugins installed. They are:
- Create custom Image: Requires a container registry
- Use init containers: Each node needs to download separately wasting bandwidth
Rally will be used to benchmark the solution and to size the cluster correctly (see Failures).
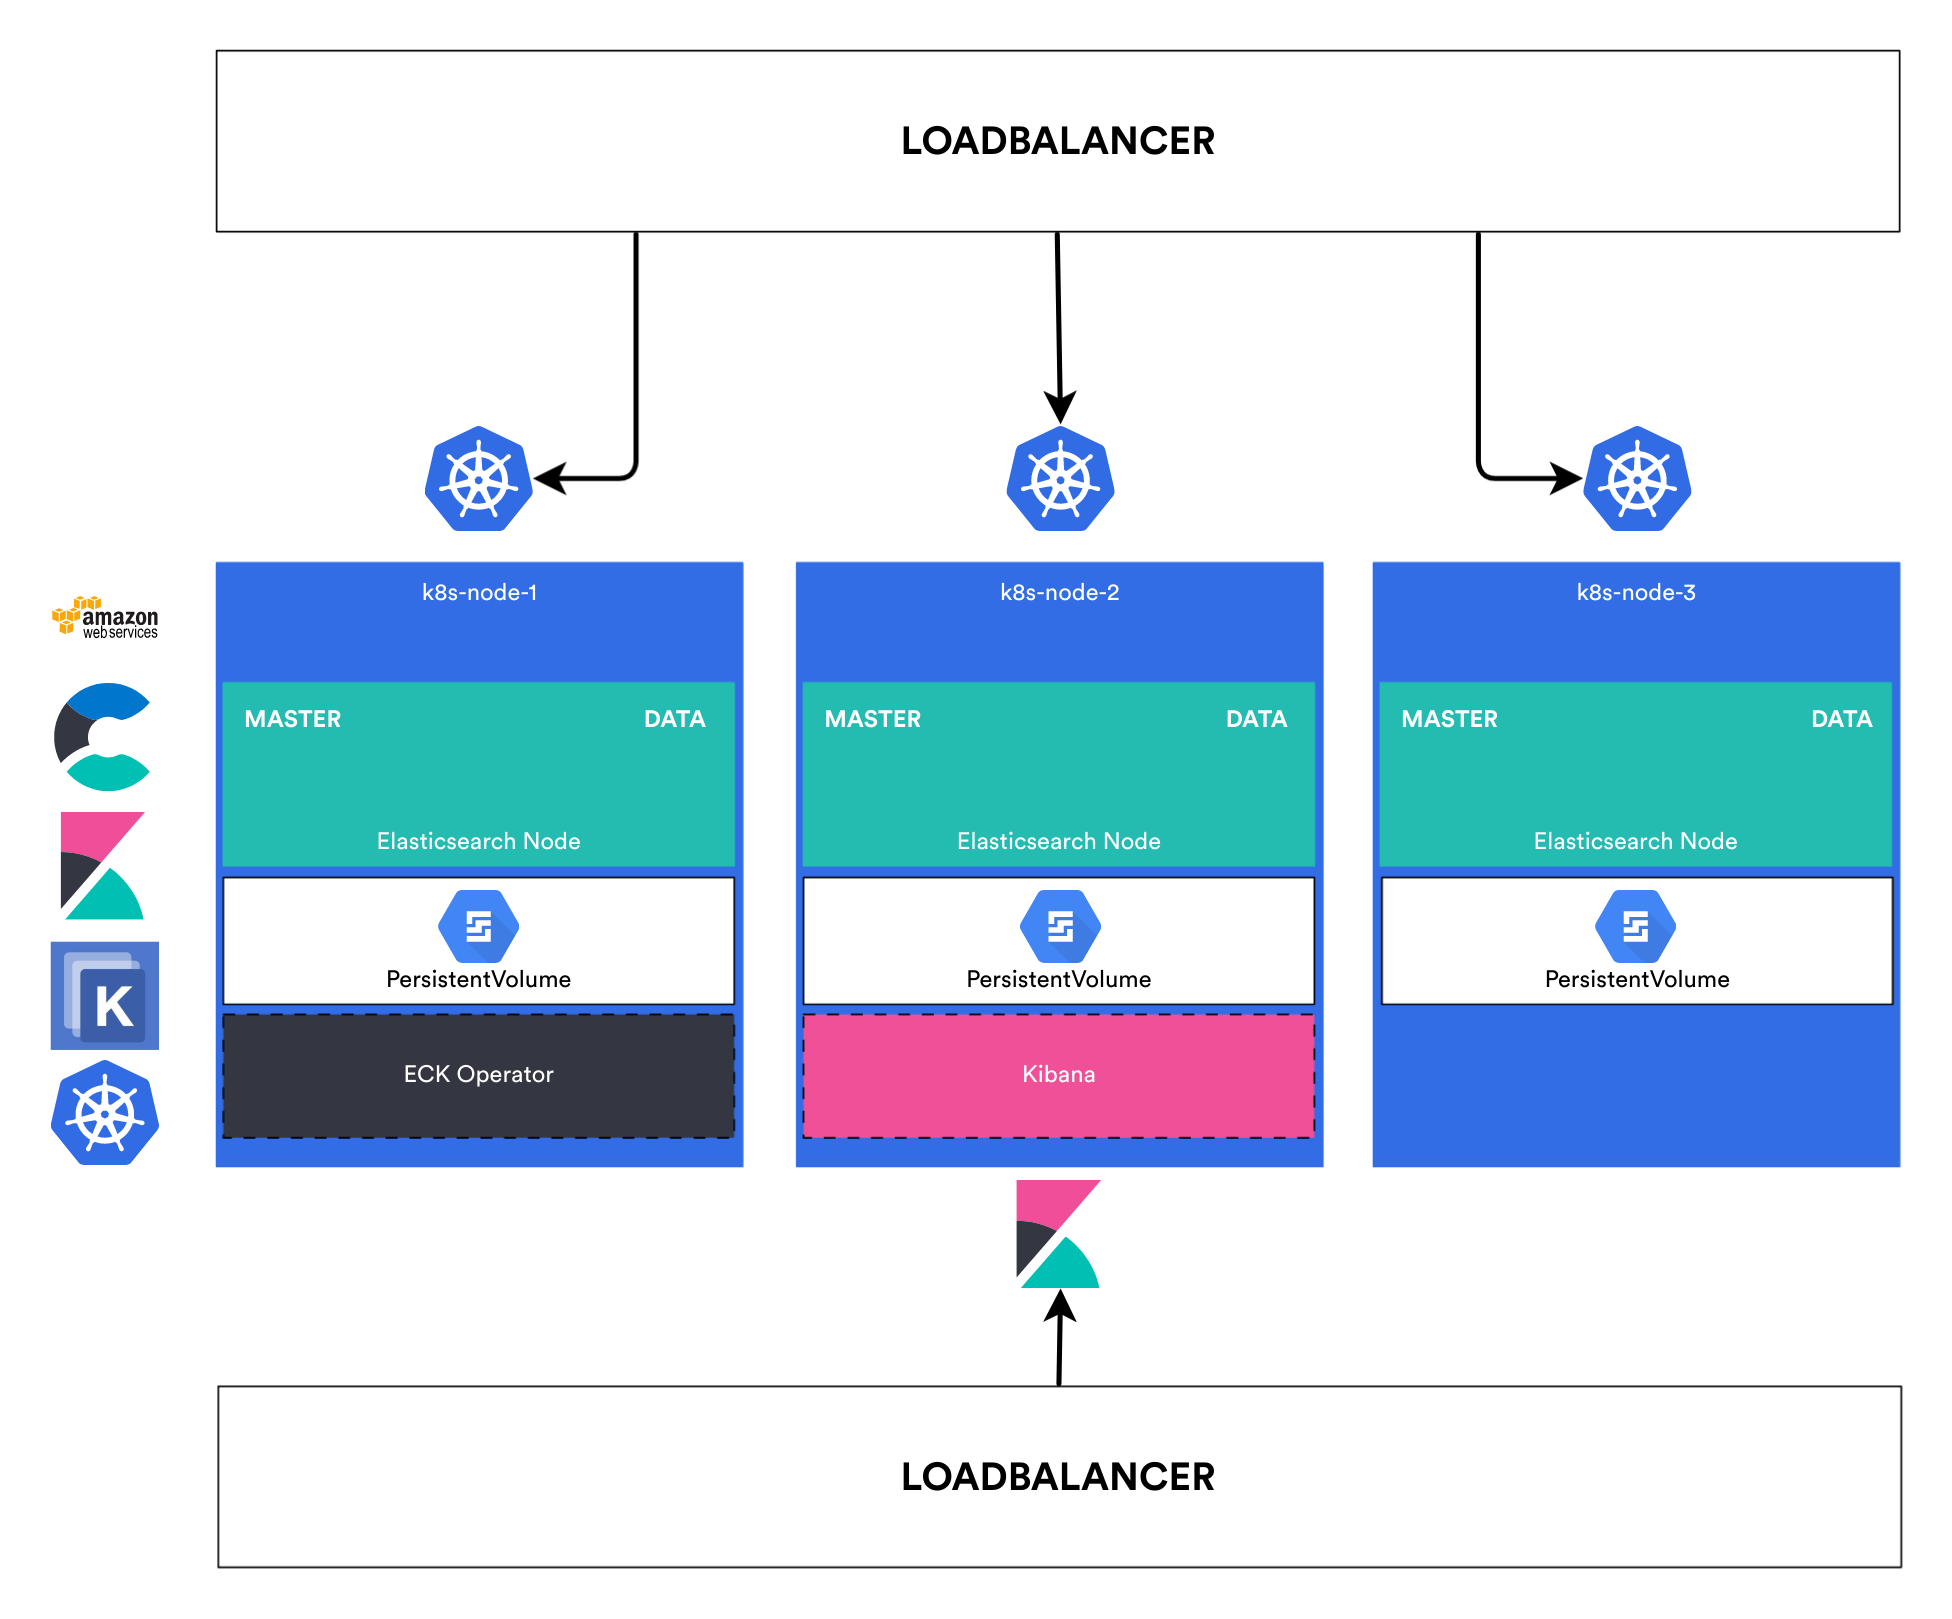
The elasticsearch cluster is configured to ensure high availability and resilience to the loss of any single node.
- ECK will be deployed using vanilla manifest files.
- The Elasticsearch cluster and Kibana will be deployed using the kustomize-generated file.
- The desired configuration will be applied by initContainers because building a registry is not a part of this solution.
- The design will be three nodes thay have the same roles which are master & data because we don't need other roles. If an Ingest Pipeline will be created,
ingestrole may be given to all nodes, too. - A load balancer will be configured to balance client requests across the nodes.
- Total shards per node won't be hard-limited as it can result in some shards not being allocated.
- This solution will go with the dynamic mapping option to define the document & how it's stored. If any example data was provided, this solution would go with explicit mapping and prevent unnecessary mapped fields.
- AWSElasticBlockStore is used, by defining aws-ebs StorageClass, to benefit from the rescheduling behavior of network-attached PersistentVolumes.
- An SLM policy will be defined to back up indices automatically by taking snapshots regularly. The snapshots will be stored in file system location as there is no S3 provided: (see Failures)
- The default JVM heap size settings are used, as it's recommended, instead of overriding the heap size. But limited the resources by specifying memory and cpuCPU on the manifest file.
- Update strategy will stay as the default behavior as unlimited maxSurge and only 1 unavailable pod at one time.
- Default PodDisruptionBudget configuration is used. It allows one Elasticsearch Pod to be taken down, as long as the cluster has green health.
- Node scheduling will remain default as Single Elasticsearch node per Kubernetes host
- Default Readiness probe configuration is used. It will be sufficient as we don't expect a heavy load.
- Default PreStop hook configuration is used for pods. ECK will wait for an additional 50 seconds when the pod is terminated, to avoid the race condition.
- Default security context configuration is used and Elasticsearch runs as root.
- Kubernetes 1.18-1.23
- Kustomize 4.3.0
- Access to an EKS cluster
Install ECK Custom Resources v1.9.1
kubectl create -f eck/eck-crds.yamlInstall ECK Operator v1.9.1
kubectl apply -f eck/eck-operator.yamlMonitor the operator logs:
kubectl -n elastic-system logs -f statefulset.apps/elastic-operatorCreate elasticsearch & kibana deployments v7.16.1 by building with kustomize. And then deploy them.
kustomize build k8s -o k8s.yaml
kubectl apply -f k8s.yaml
Watch until the pods are ready and then check the status of the cluster. It may take a couple of minutes.
watch kubectl get pods -n elastic-ha

kubectl get elasticsearch -n elastic-ha

kubectl get kibana -n elastic-ha
Get the external IP and port of elasticsearch load balancer:
kubectl get svc -n elastic-ha | grep ha-es-httpGet the password of elastic user
kubectl -n elastic-ha get secret ha-es-elastic-user -o go-template='{{.data.elastic | base64decode}}'Visit https://{EXTERNAL-IP}:{PORT} from browser. You will get a "Your connection is not private" error.
Click Advanced and click Proceed to {EXTERNAL-IP} (unsafe)
Login with elastic user and the password which you copied on the previous step.
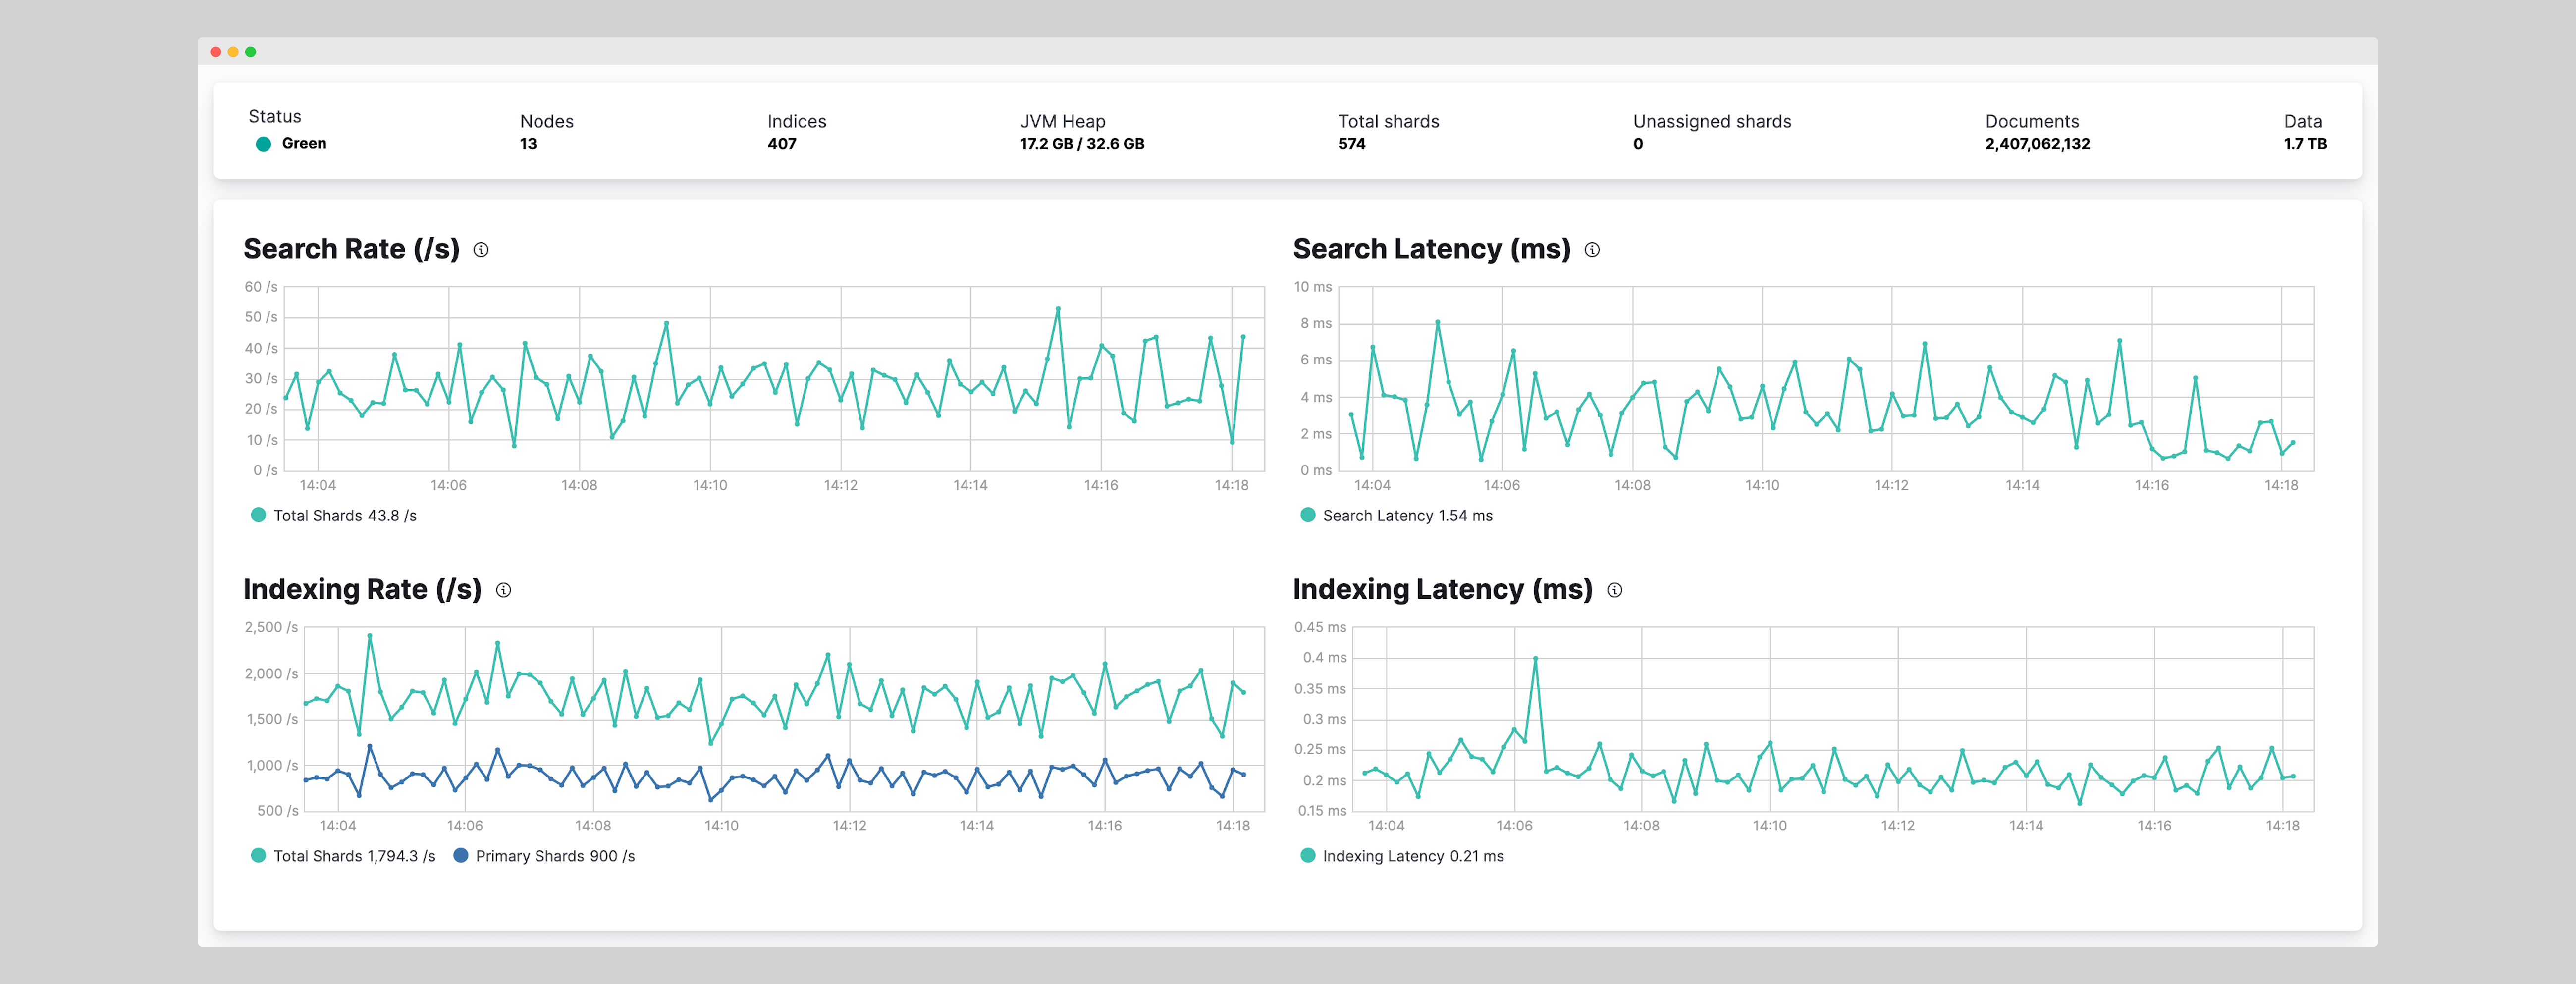
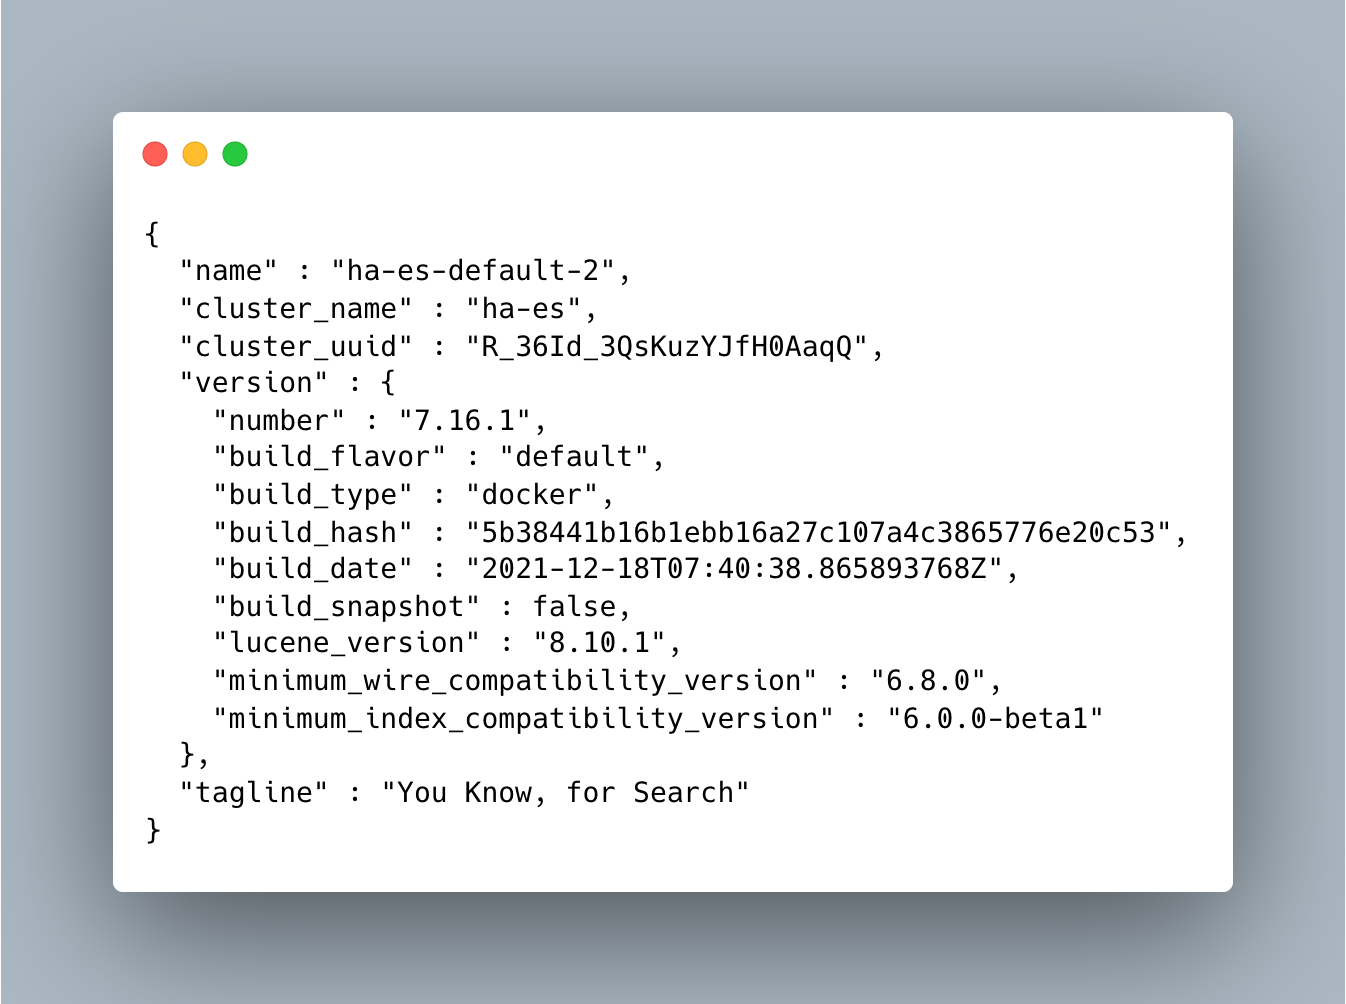
You should get a screen like this:
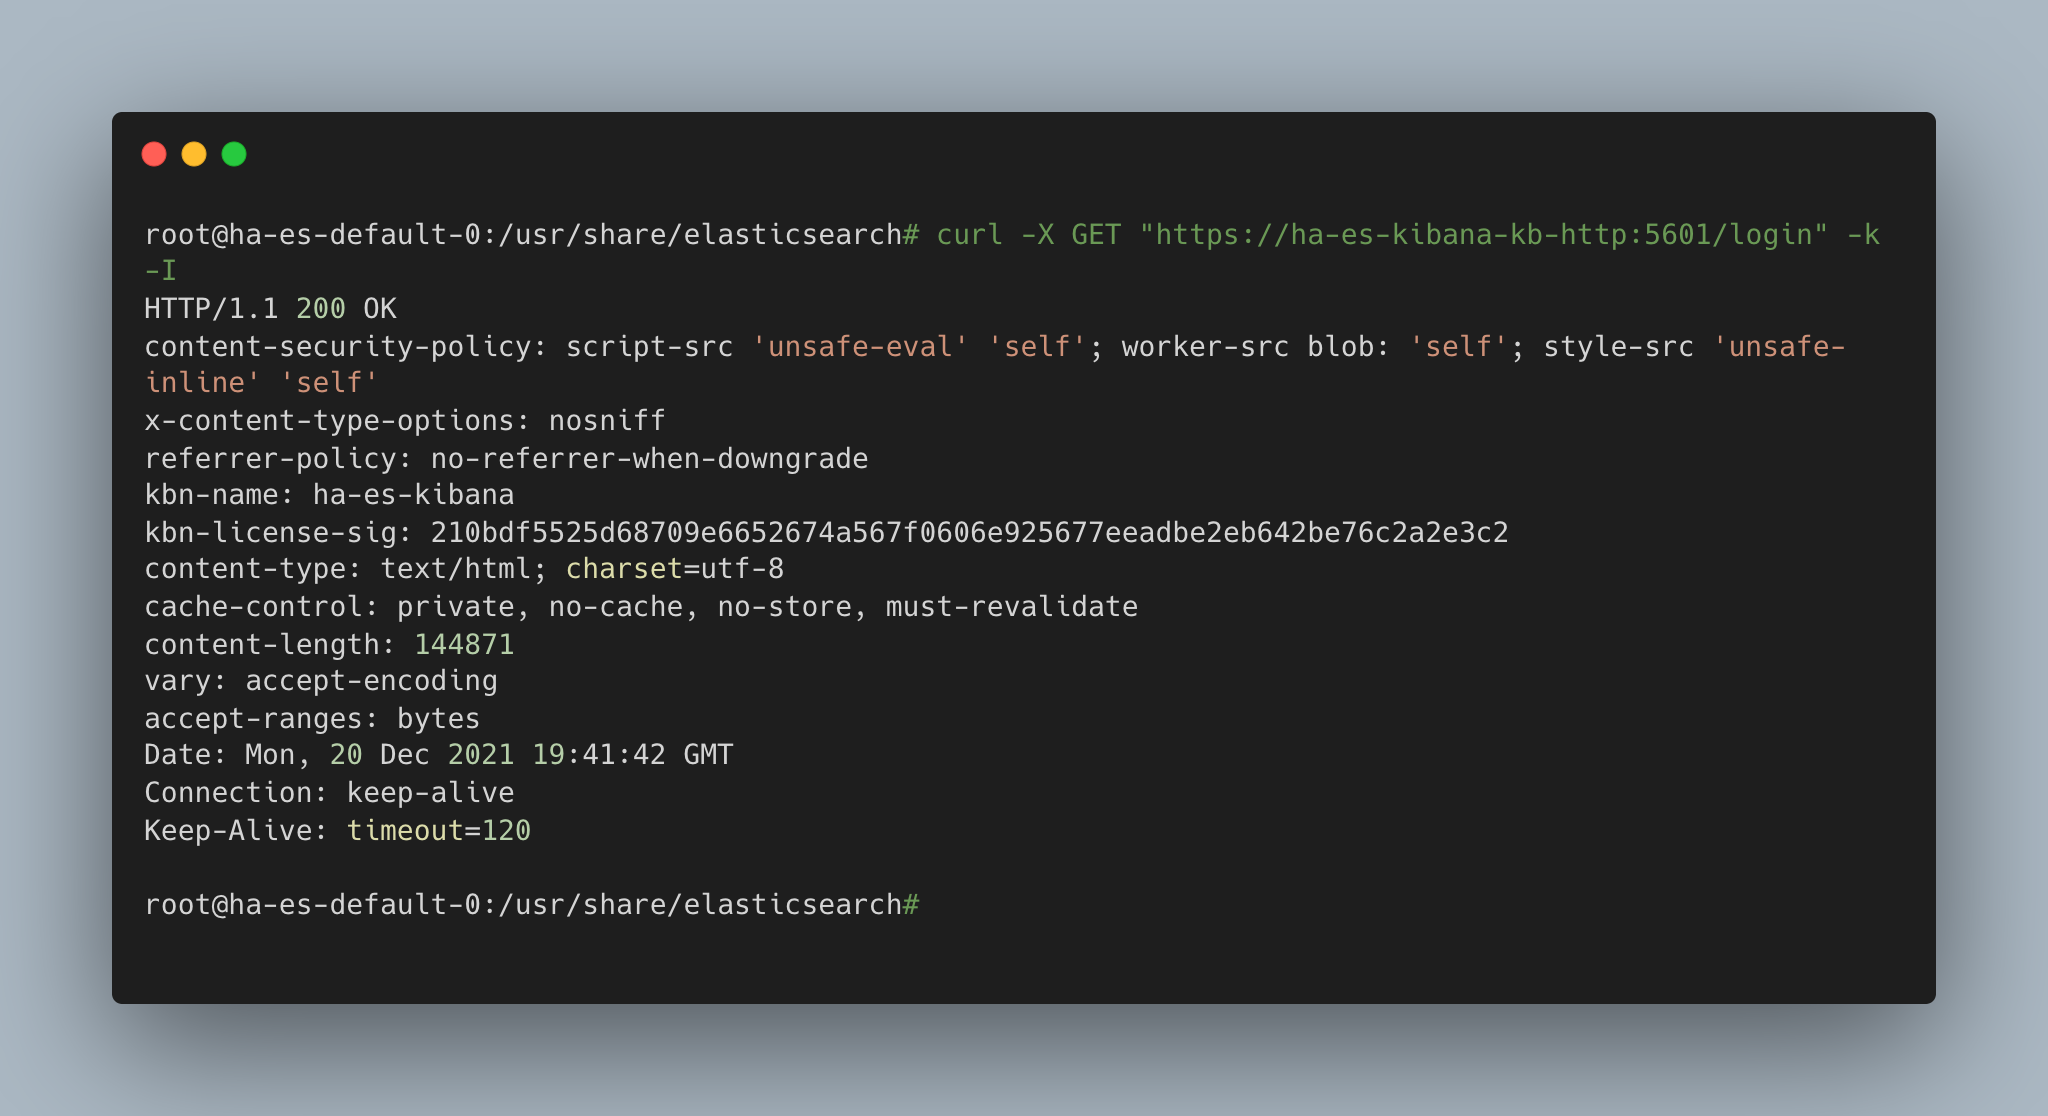
Kibana is configured and ready-to-use too. But to visit Kibana, the 5601 ports of the EC2 Instances should be configured. To verify that kibana is ready, you can send a curl request from elasticsearch pod.
kubectl -n elastic-ha exec -ti ha-es-default-0 bash

curl -X GET "https://ha-es-kibana-kb-http:5601/login" -k -I
You should get a response like this:
- I have designed highly-available-elasticsearch to take automated snapshots. However, I couldn't manage to register a statically provisioned filesystem repo. So I couldn't add the CronJob or SLM Policy which are mentioned in The Solution
- I was going to benchmark the solution using Rally. But that is something that I couldn't make on time.


