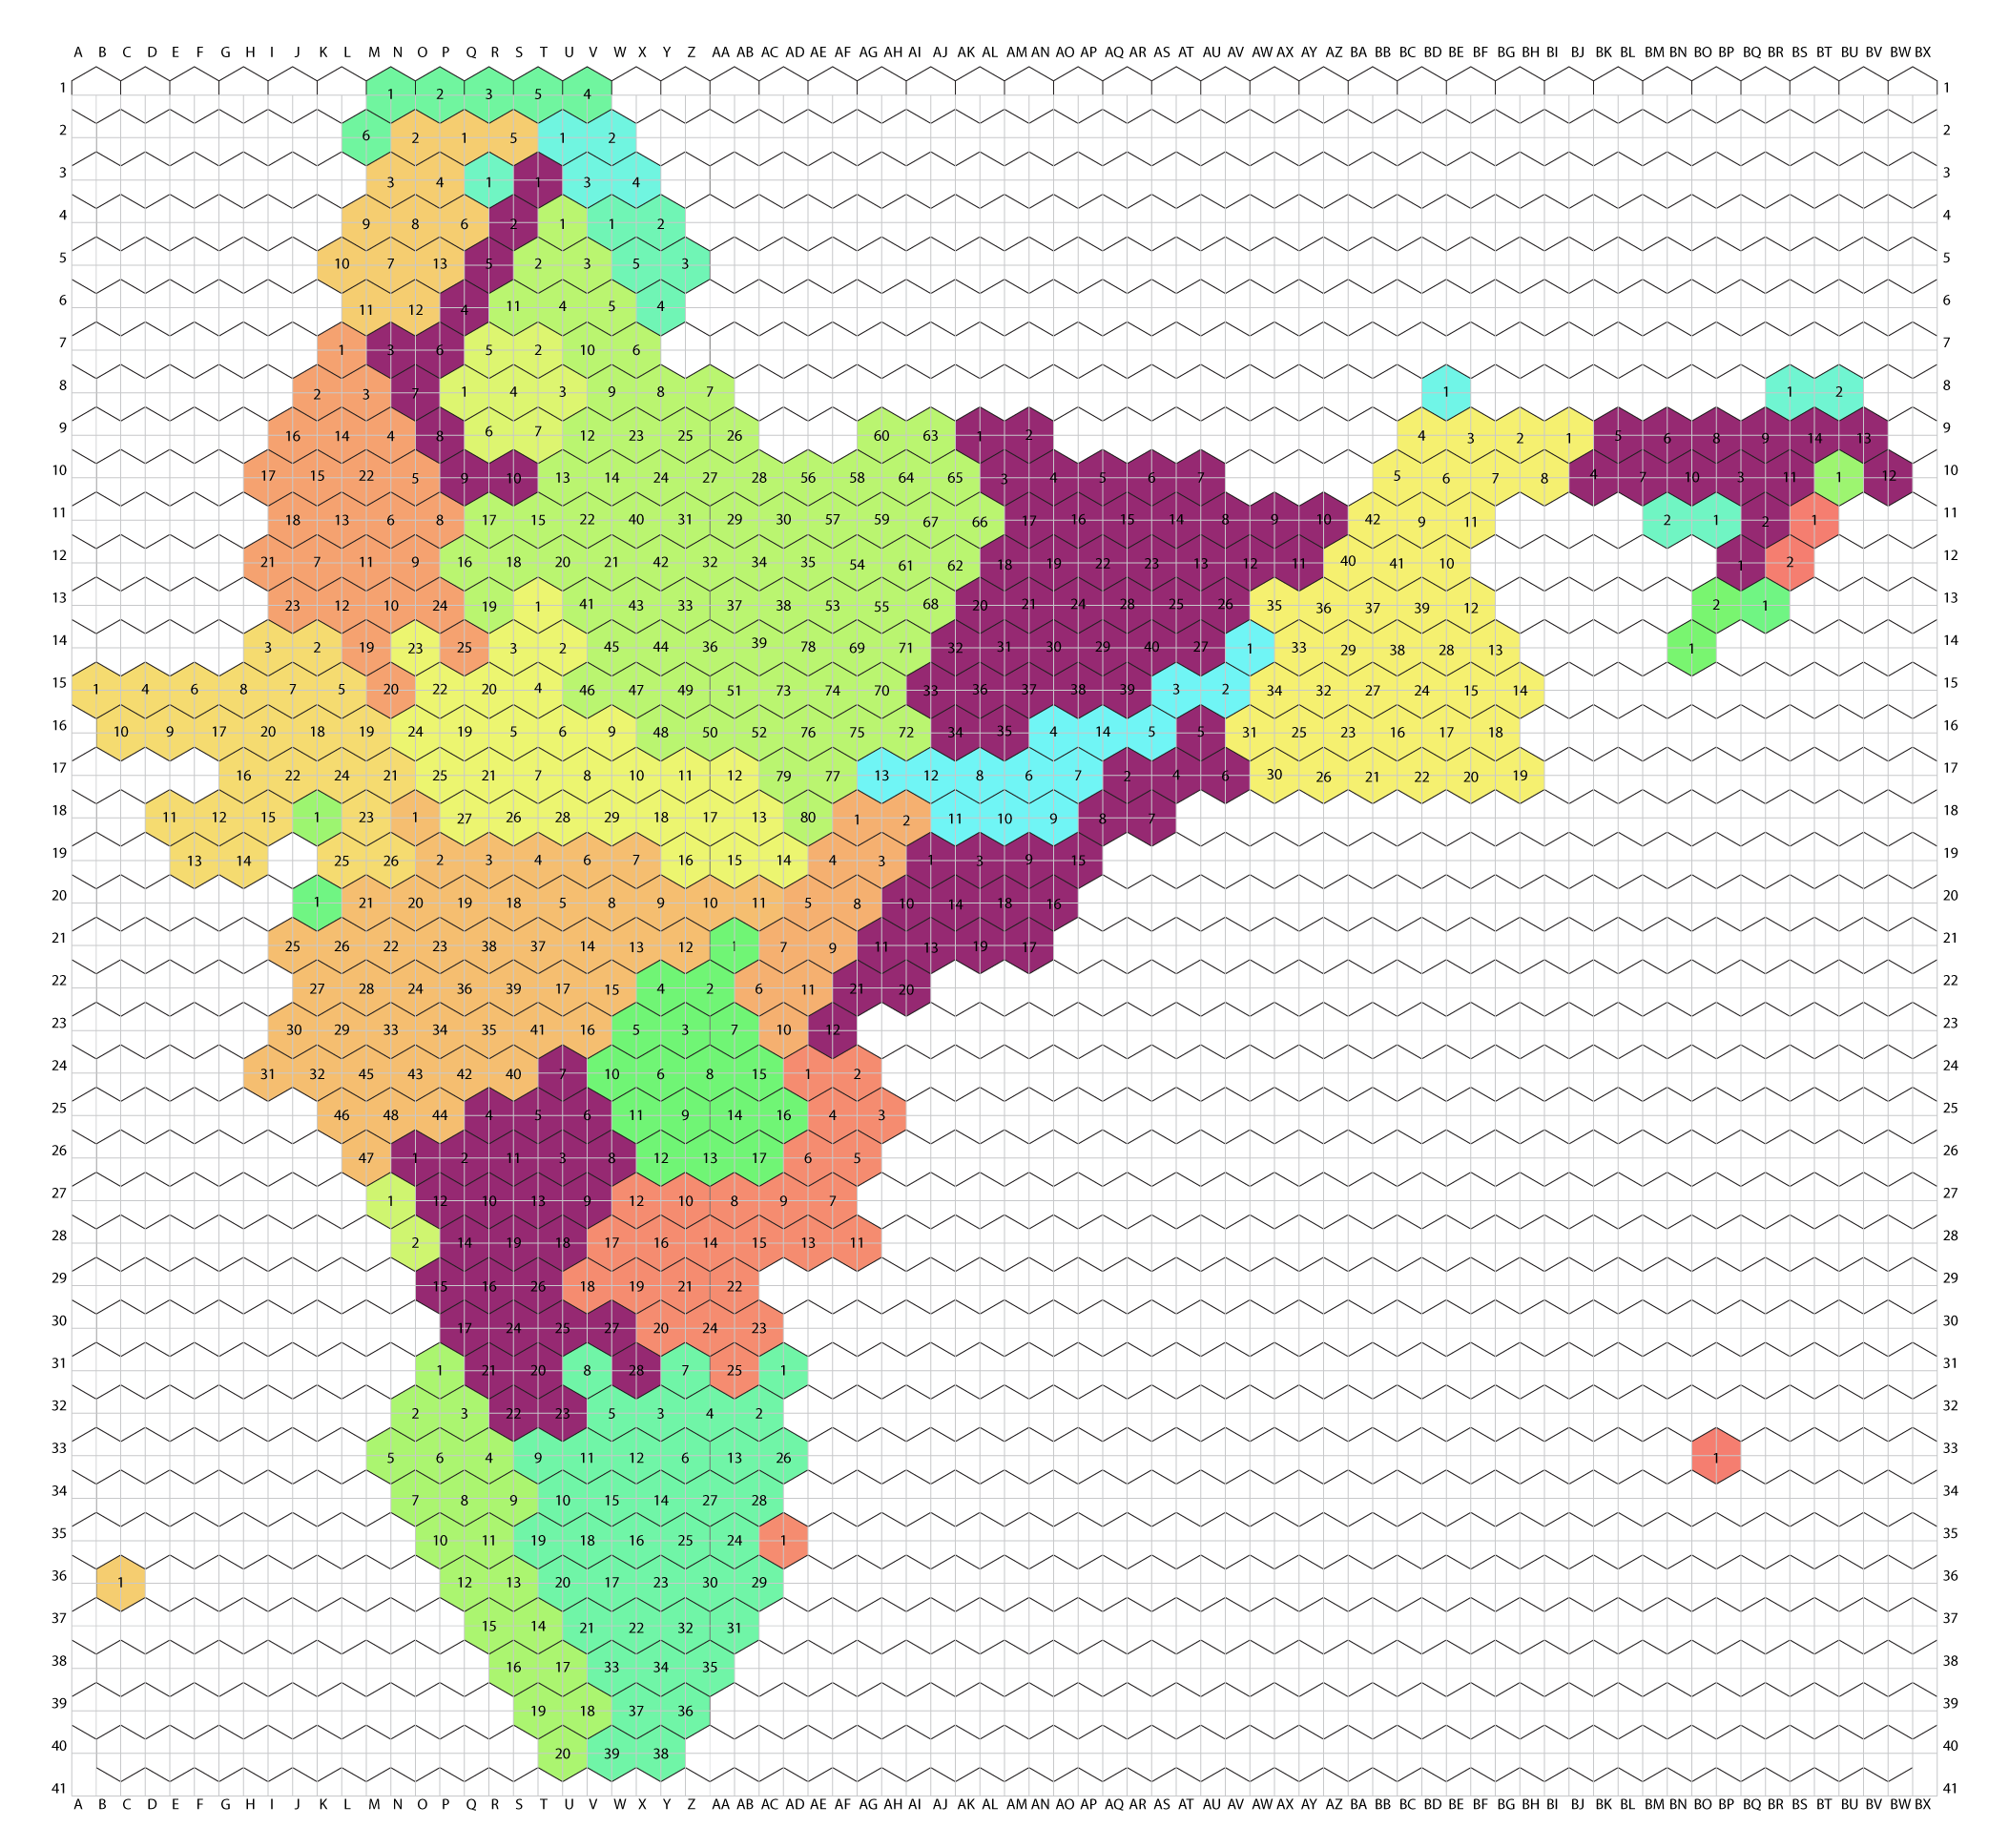
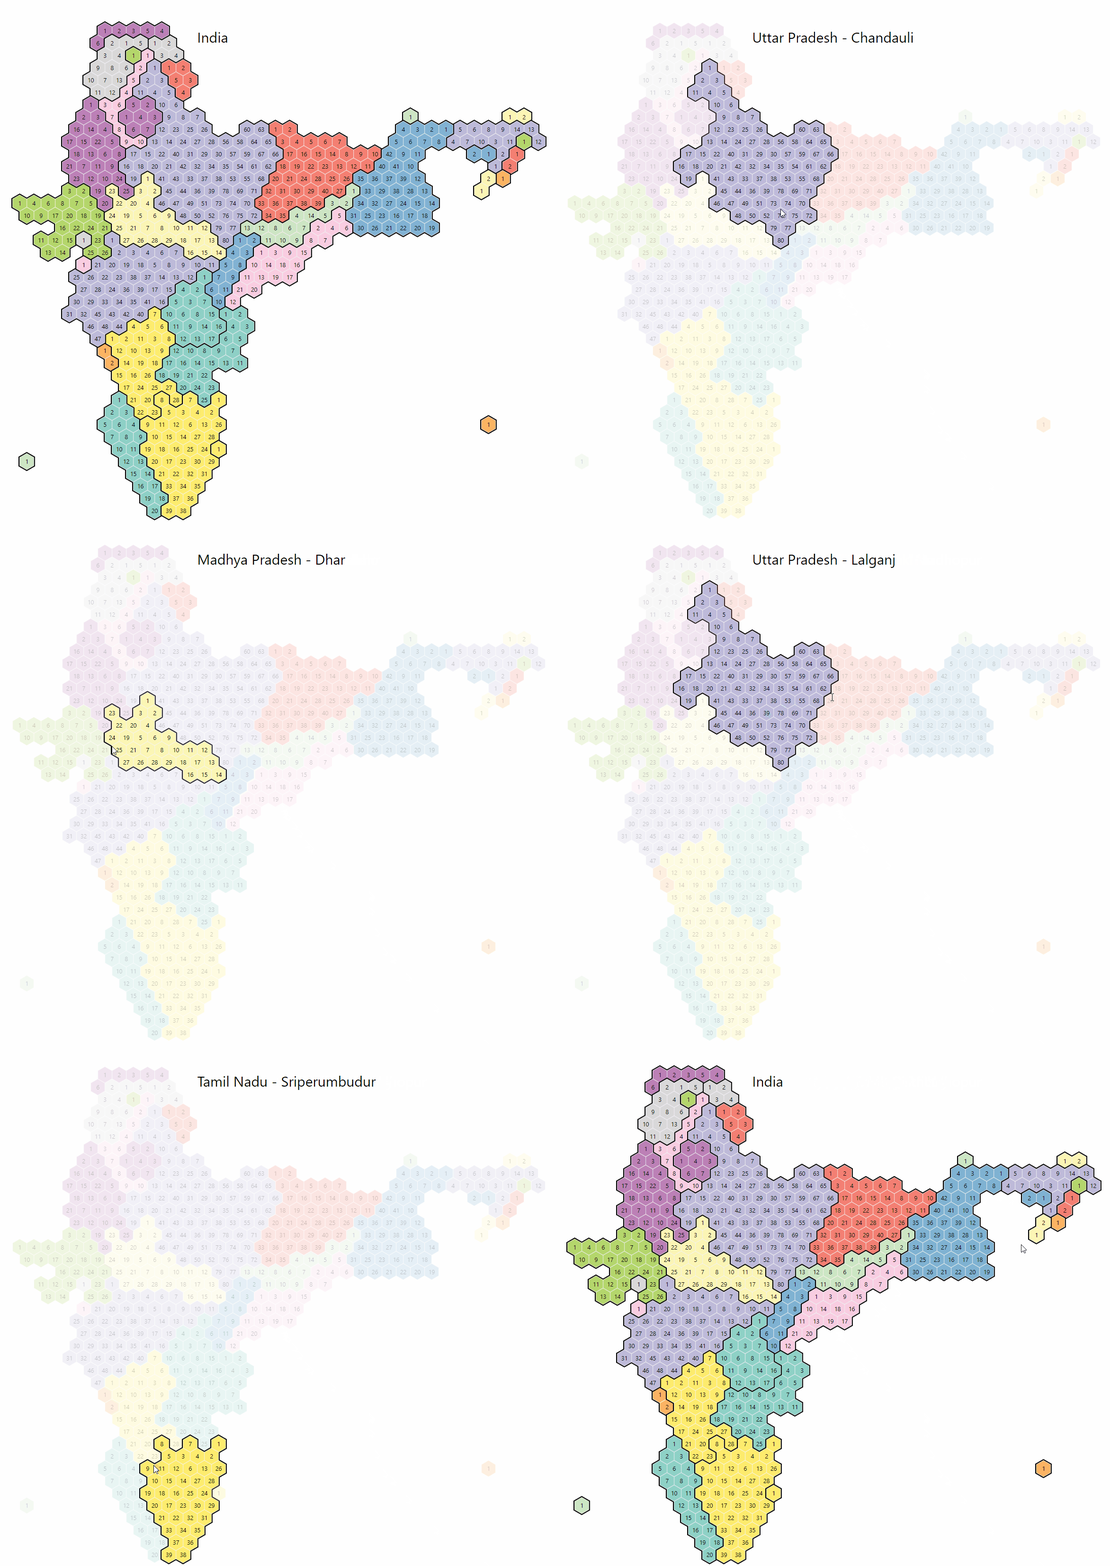
A “tilegram” is a map made of tiles where regions are sized proportionally to a dataset. More details can be found here
This project containes the datasheet for creating a tilegram of India where each tile represent one Lok Sabha contituency of India.
The base tilegram was take from https://pitchinteractiveinc.github.io/tilegrams/
This map was used to generate a excel sheet as grid with each cell as the state code and name of the constituentcy / consticuency no.
There are datafiles in 2 format:
- CSV
- JSON
CSV
There are 2 json file:
The only difference between two files is that tiles-data-contituency-name.csv has the contituency names with the states and tiles-data-contituency-no.csv has contituency no. with the state.
CSV files shows the location of the constituencies in the grid as [x,y] position. The location of the center of the hexagon for a constituencies located at x,y position (here x is column no. and y is row no.) in csv file is [x * radius, y * 1.5 * radius / Math.cos (Math.PI / 6)] here radius is the size of the hexagon.
JSON
There are 2 json file:
The only difference in both the files is the hierarchy of objects.
A single data object for contituency looks like
"Name": "Kokrajhar",
"Reserved": "ST",
"State": "AS",
"Constituency No": "5",
"Coordinate": [
  62,
  8
],
"stateCode": "S03",
"stateFullName": "Assam"
The location of the center of the hexagon is [Coordinate[0] * radius, Coordinate[1] * 1.5 * radius / Math.cos (Math.PI / 6)] here radius is the size of the hexagon.

