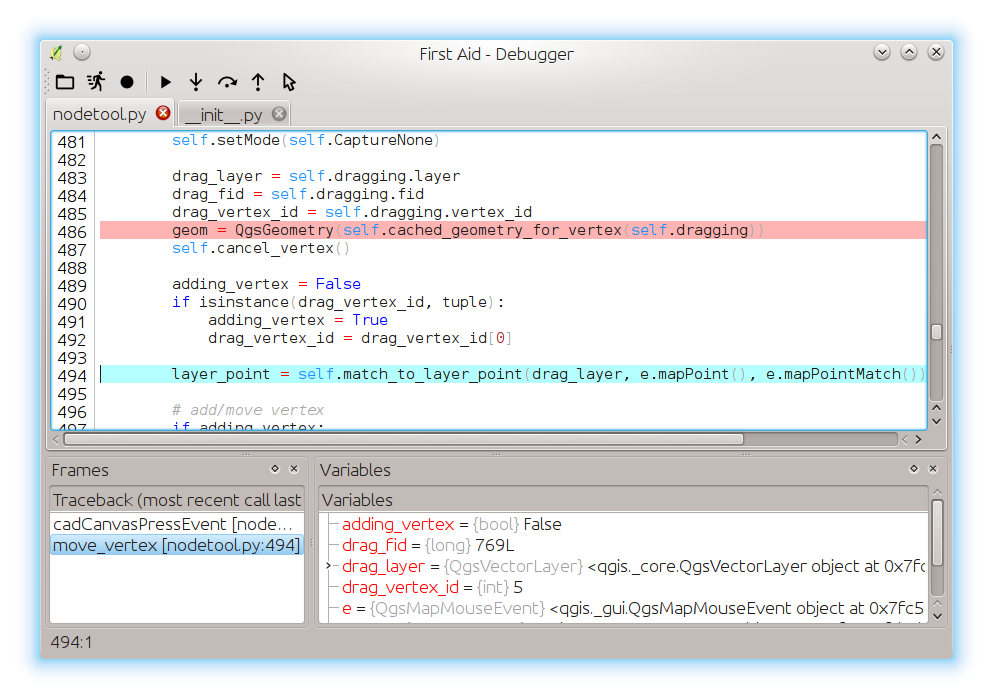
The plugin adds a debugger for Python code that runs with QGIS - making it super easy to trace any plugin. It supports all the usual features from other debuggers - set breakpoints, inspect variables, step into/over code etc.
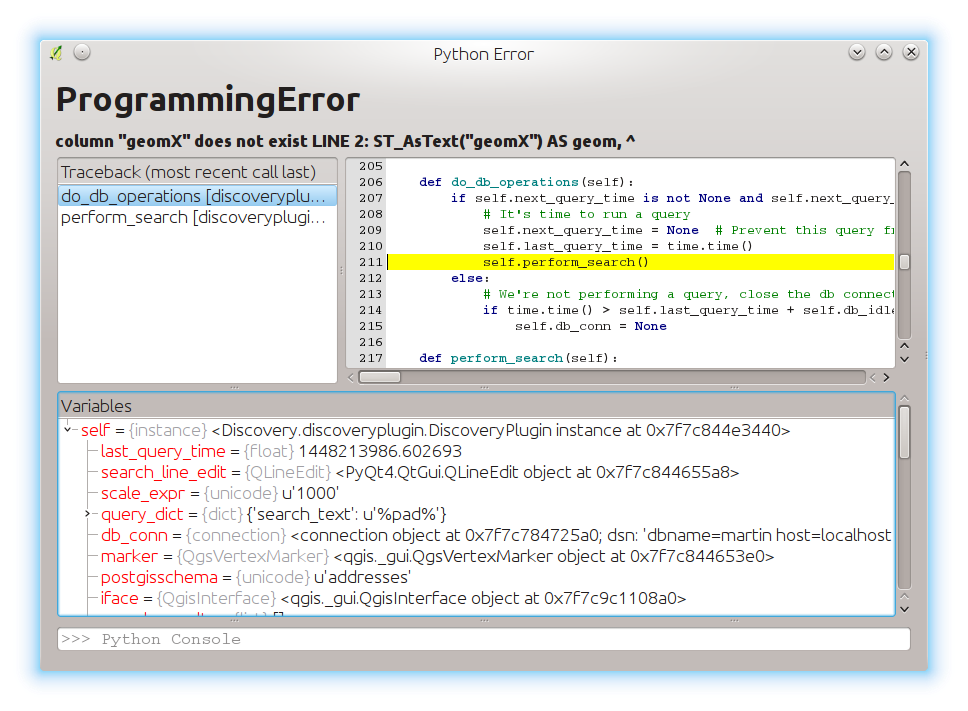
It also replaces the default Python error handling in QGIS with a more sophisticated handler that allows more thorough inspection or the Python error: browse the frames, view variables, see source code or even execute Python code within the context of the error.
Simply install the plugin and enable it. The custom error handler is registered automatically. In order to start the debugger, look for Debug icon in Plugins toolbar - or press F12. A new window will pop up where you can open files and set breakpoints. Debugging is active all the time while the debugger window is open. Once a breakpoint is reached, debugger window will be activated and ready to step through the code.
Debugger:
Custom Python error handler:
Licensed under the terms of GNU GPL 2.

