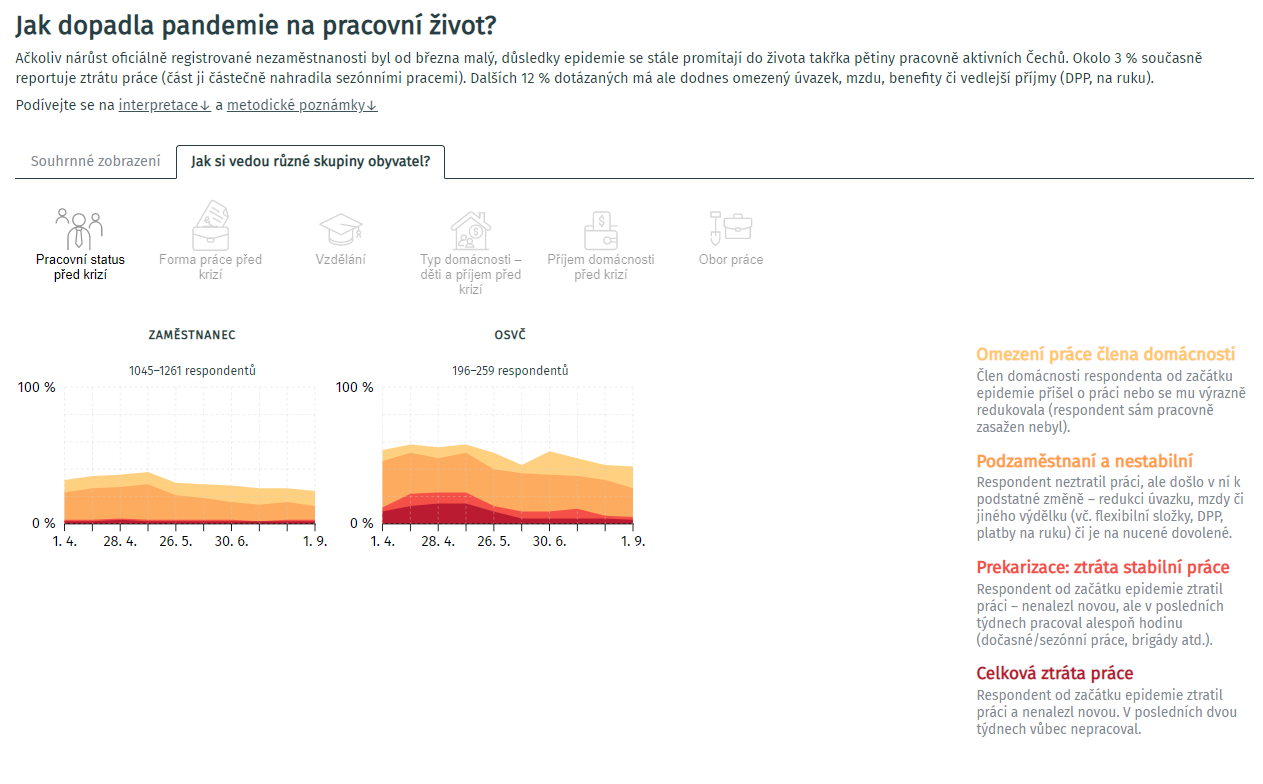
Data visualization application for research Život během pandemie (by PAQ Research).
Developed with Next.js - The React Framework.
Running on Vercel - Develop. Preview. Ship.
Visualized with Semiotic - a data visualization framework for React.
First, run the development server:
npm run dev
# or
yarn dev
Open http://localhost:3000 with your browser to see the result.
Lear more: Next.js Documentation.
