This repo contains archetypes that should be useful to camel developers that don't want to start with common things already included in their projects such as monitoring, circuit breaking, swagger ui etc..
It also contains the a comprehensive Grafana Dashboard for performance monitoring on metrics collected through Prometheus.
The following is a Spring Boot archetype
mvn archetype:generate \
    -DarchetypeGroupId=io.github.alainpham \
    -DarchetypeArtifactId=spring-boot-camel \
    -DarchetypeVersion=1.0.0
The following is a Quarkus archetype
mvn archetype:generate \
    -DarchetypeGroupId=io.github.alainpham \
    -DarchetypeArtifactId=quarkus-camel \
    -DarchetypeVersion=1.0.0
mvn archetype:generate \
    -DarchetypeGroupId=io.github.alainpham \
    -DarchetypeArtifactId=plain-java \
    -DarchetypeVersion=1.0.0
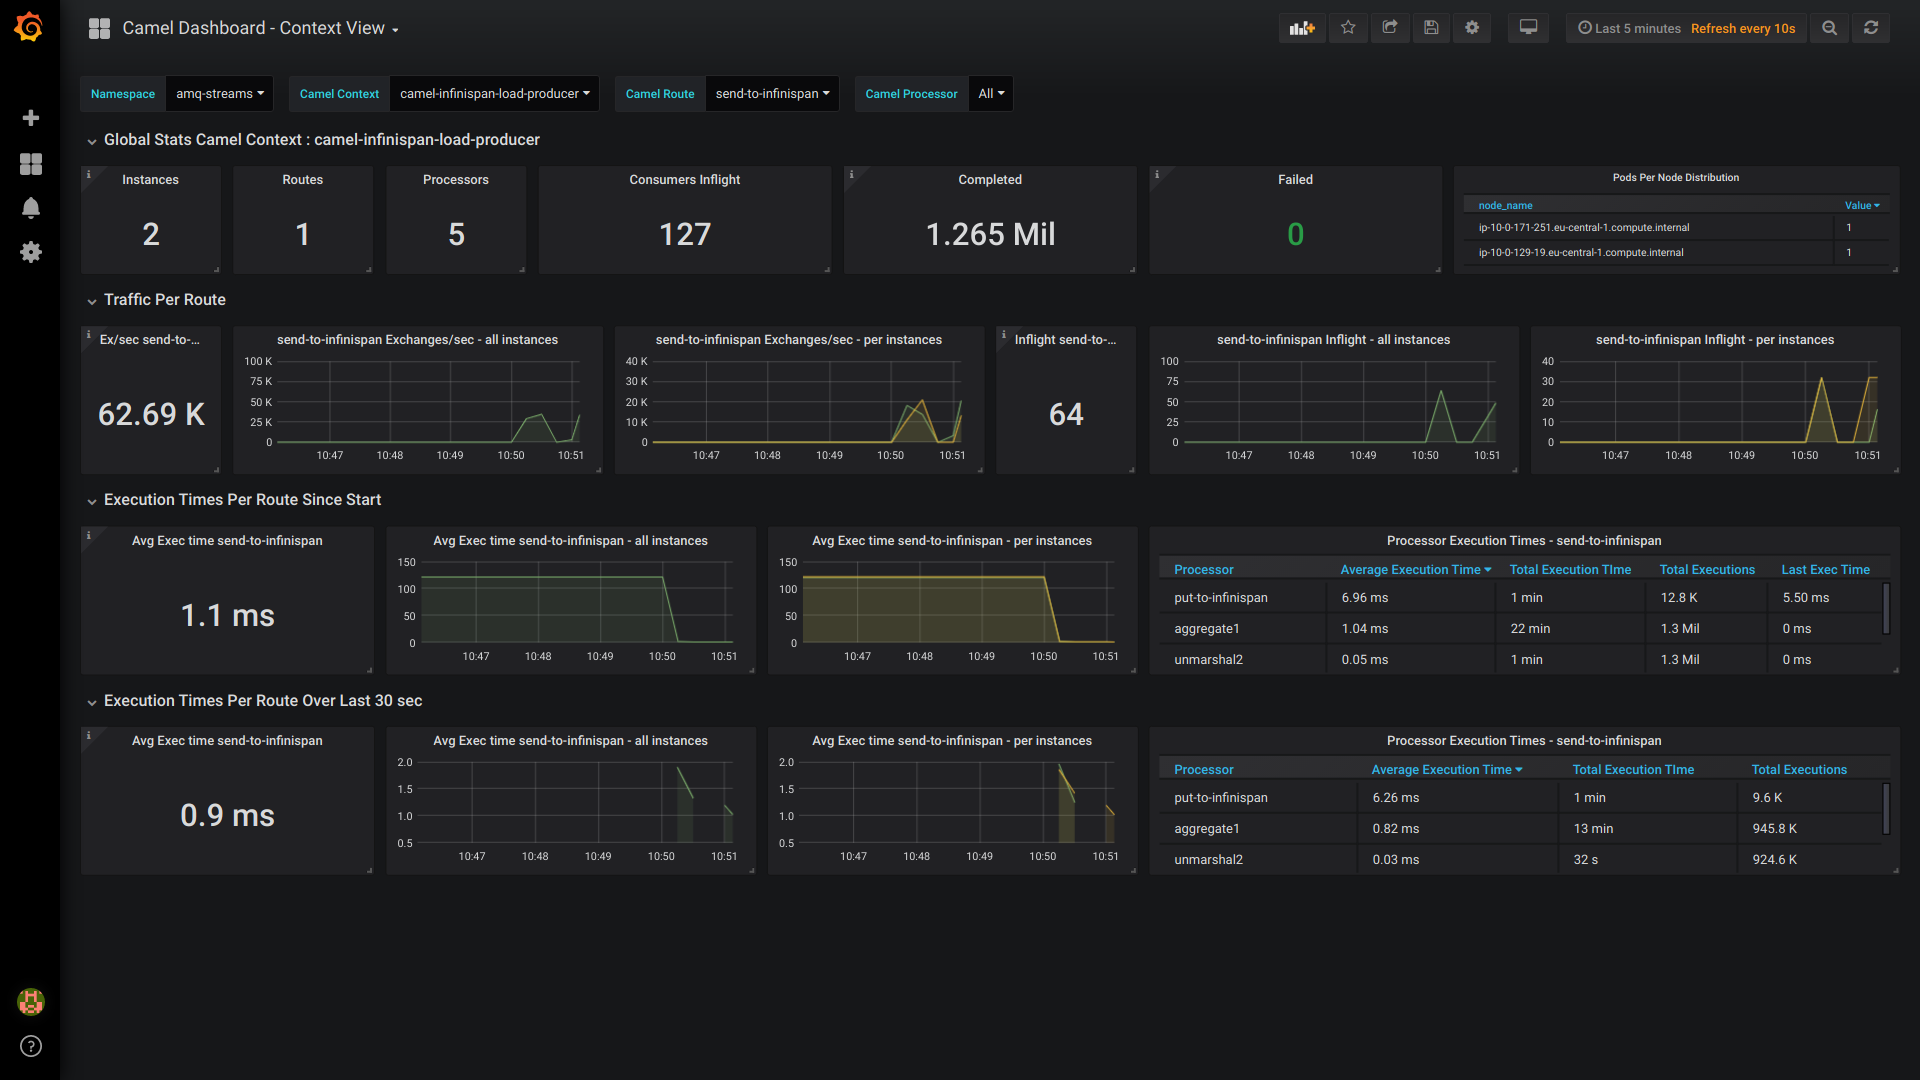
The dashboard that you can import can be found here
It gives comprehensive metrics for performance monitoring. It focuses on monitoring route execution rate and average executions times that is broken down to processors & routes. You can use it to find your bottlenecks and detect degradations in quality of service.
Videos : http://www.youtube.com/watch?v=0LDgv1nIk-Y
Use these commands if you want to quickly test the archetype out including some monitoring
oc project ###YOUR_TARGET_NAMESPACE_HERE###

cat camel-monitoring/prometheus-local.yaml | sed -E "s/TARGET_NAMESPACE/###YOUR_TARGET_NAMESPACE_HERE###/"| oc apply -f -

oc create configmap grafana-dashboards --from-file=camel-monitoring/dashboards

oc apply -f camel-monitoring/grafana.yaml
Follow these instructions linked here to have Prometheus and Grafana running as local docker containers.
https://github.com/alainpham/dev-env-scripts#monitoring
By editing the prometheus config we can set static targets on your local env to emulate the behavior of auto discovered pods on Kubernetes.
| Components | Version |
|---|---|
| camel-version | 3.4.0 |
| spring-boot-version | 2.3.1.RELEASE |
| swagger-ui-version | 3.26.1 |
| swagger-codegen-version | 2.4.14 |
| fmp-version | 4.4.1 |
| cxf-codegen-plugin-version | 3.3.6 |
| logstash-encoder-version | 6.4 |
| webjars-locator-version | 0.40 |
| hawtio-springboot-version | 2.10.0 |
| jmx_prometheus_javaagent | 0.13.0 |
| Components | Version |
|---|---|
| quarkus-version | 1.9.2.Final |
| camel-version | 3.6.0 |
- Build a Dashboard for Camel Quarkus with the microprofile metrics componenents. This will be great for SLA management as their are some cool metrics like quantiles on execution time.