I forked this repository from cd0583-model-scoring-and-drift-using-evidently and followed the instructions below. The final app is deployed on
https://model-scoring-evidently-demo.herokuapp.com/
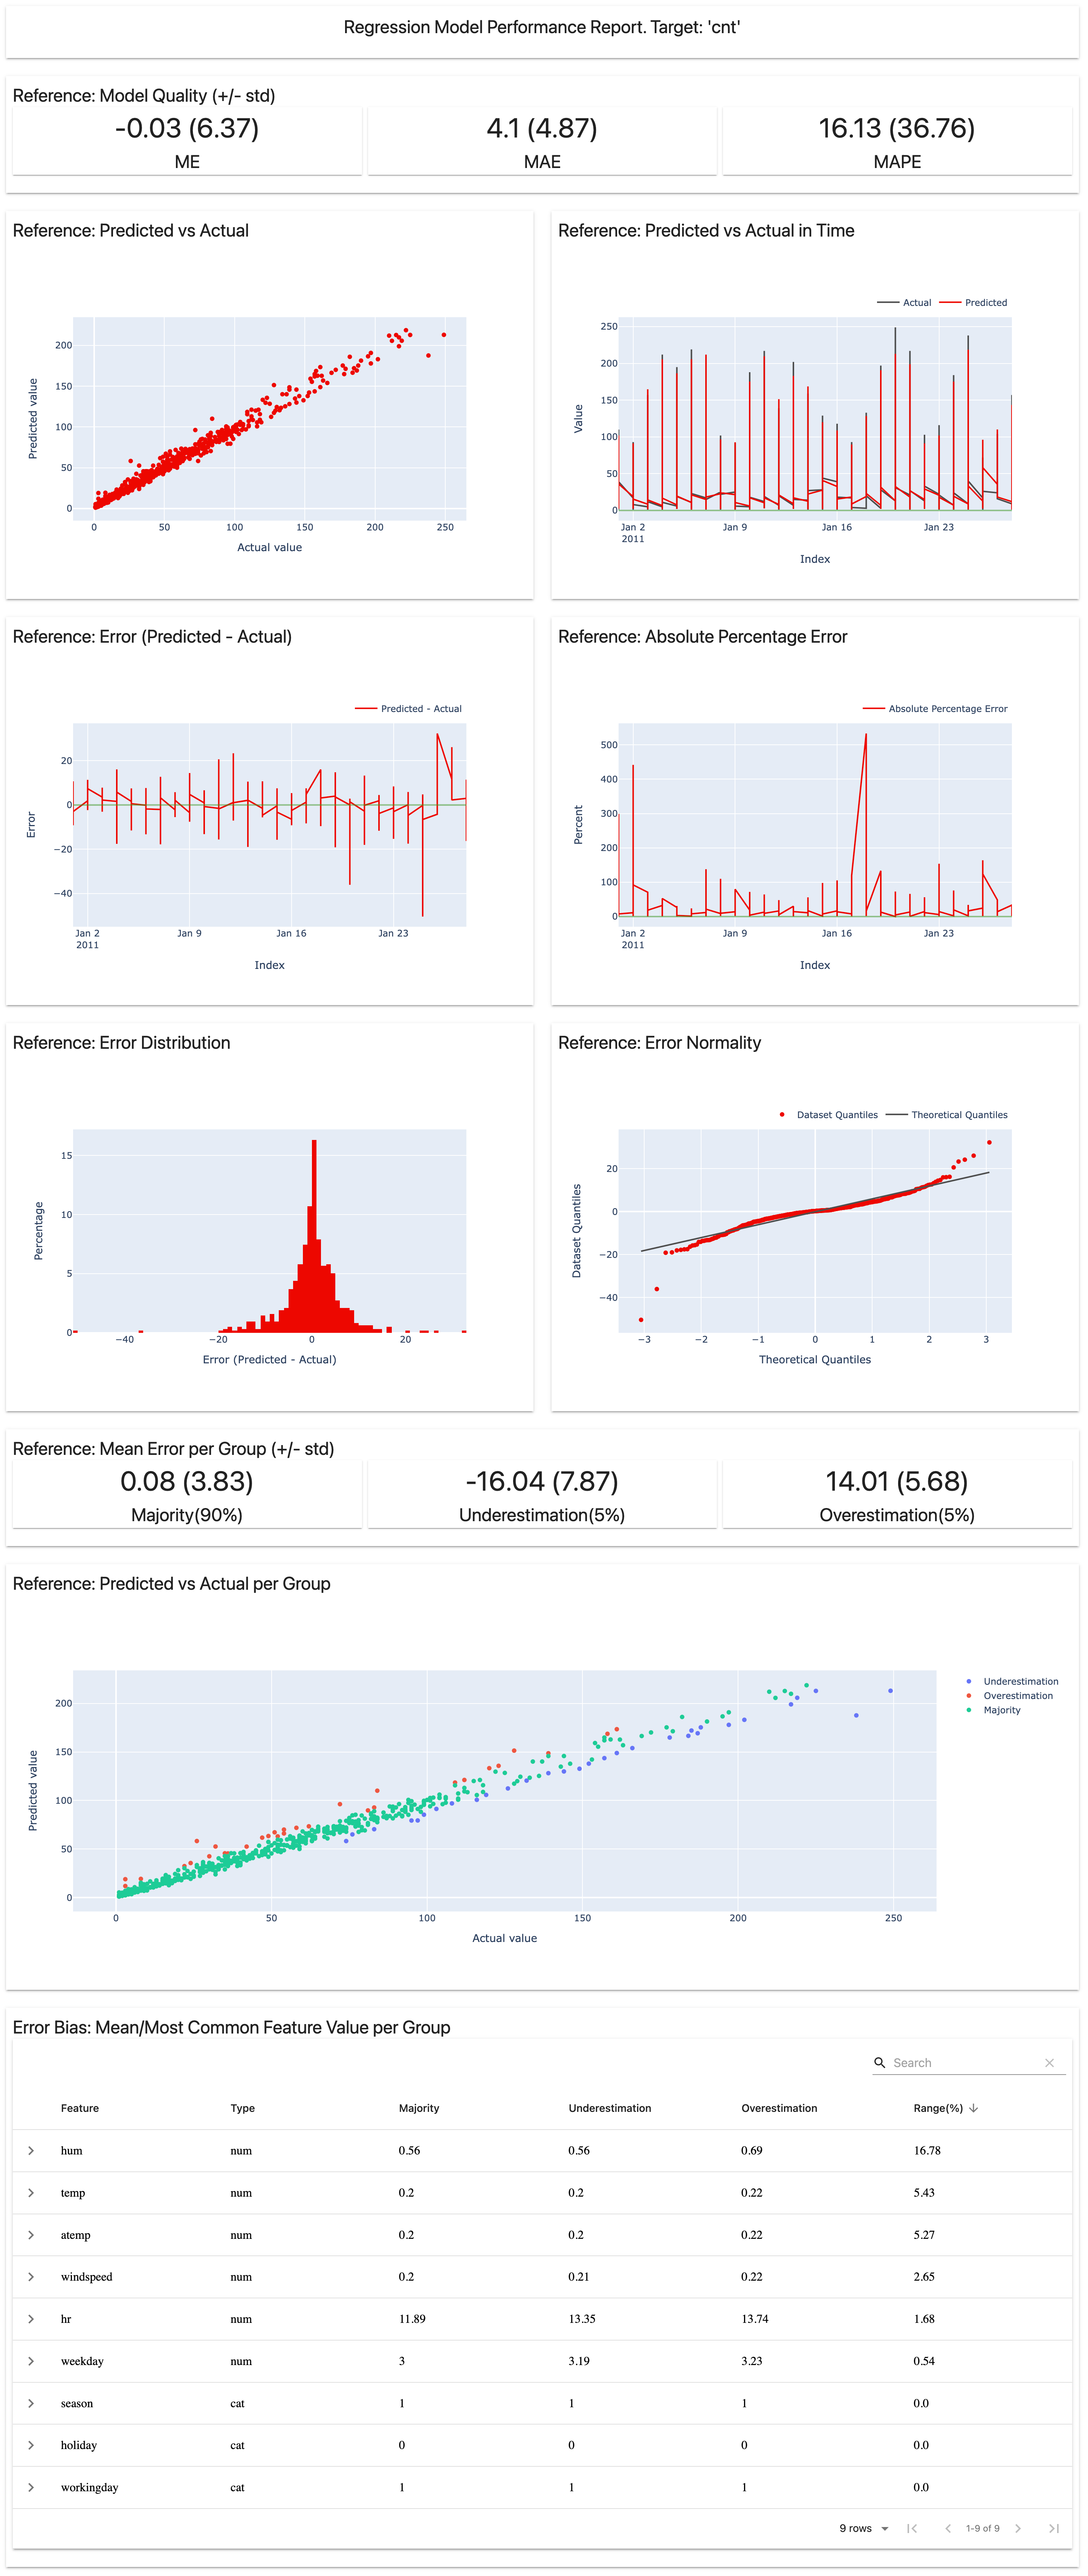
That main link shows the model performance for February; check other links/dashboards mentioned below.
The complete monitoring is implemented in
main.py: We create HTML dashboards with Evidently and save them to./static. Then, a FastAPI web app is instantiated to which we pass all the content in that./staticfolder.
In this tutorial, we will learn how to monitor machine learning models in production using an open-source framework called Evidently. In their own words - "Evidently helps analyze and track data and ML model quality throughout the model lifecycle. You can think of it as an evaluation layer that fits into the existing ML stack."
Evidently helps in generating:
- Interactive visual reports - Evidently has the ability to generate interactive dashboards (.html files) from the pandas dataframe or the
.csvfiles. In general, 7 pre-built reports are available. - Data and ML model profiling - JSON profiles that can be integrated with tools like Mlflow and Airflow.
- Real time monitoring - Evidently's monitors collect data and model metrics from a deployed ML service. This functionality can be used to build live dashboards.
Checkout this README to learn more about Evidently.
We will be using the UCI Bike Sharing Dataset and work with a Regression model deployed on Heroku. Our focus is going to be on data drift which is a type of model drift. Evidently will help us with the following
- Model Quality - Evaluate model quality using performance metrics and track when/where the model fails.
- Data Drift - Run statistical tests to compare the input feature distribution and visualize the data drift (if any).
- Target Drift - Assess how model predictions and target behavior change over time.
- Data Quality - Get data health and dig deeper into feature exploration.
-
Ensure that you have a Github and Heroku account.
-
Clone this repository:
#git clone https://github.com/udacity/cd0583-model-scoring-and-drift-using-evidently.git
git clone https://github.com/mxagar/model_scoring_evidently_demo
staticfolder: contains the .html files generated in Heroku.Procfile: to get the necessary commands working in Heroku.main.py: Python file containing the code to train the model and check the drift.requirements.txt: contains the libraries to be installed in Herokuruntime.txt: contains the python runtime to be installed in Heroku
The main.py file works on monitoring bike demand data. It involves the following steps:
-
Read the data into a pandas dataframe.
-
Build and train a regression model.
-
Use Evidently to evaluate model performance. To that end we first implement column mapping as shown below:
column_mapping = ColumnMapping()

column_mapping.target = target
column_mapping.prediction = prediction
column_mapping.numerical_features = numerical_features
column_mapping.categorical_features = categorical_features
-
The following code helps in getting the model performance and building a dashboard.
regression_perfomance_dashboard = Dashboard(tabs=[RegressionPerformanceTab()])
regression_perfomance_dashboard.calculate(reference,
                                        None,
                                        column_mapping=column_mapping)
regression_perfomance_dashboard.save("./static/index.html")
Note: We have implemented the code to evaluate performance for Week 1, 2, and 3.
-
Data Drift is calculated using the code below:
column_mapping = ColumnMapping()

column_mapping.numerical_features = numerical_features

data_drift_dashboard = Dashboard(tabs=[DataDriftTab()])
data_drift_dashboard.calculate(reference,
                                current.loc['2011-01-29 00:00:00':'2011-02-07 23:00:00'],
                                column_mapping=column_mapping)

data_drift_dashboard.save("./static/data_drift_dashboard_after_week1.html")
Note: We have implemented the code to calculate data drift for Week 1 and 2.
Follow the steps mentioned below:
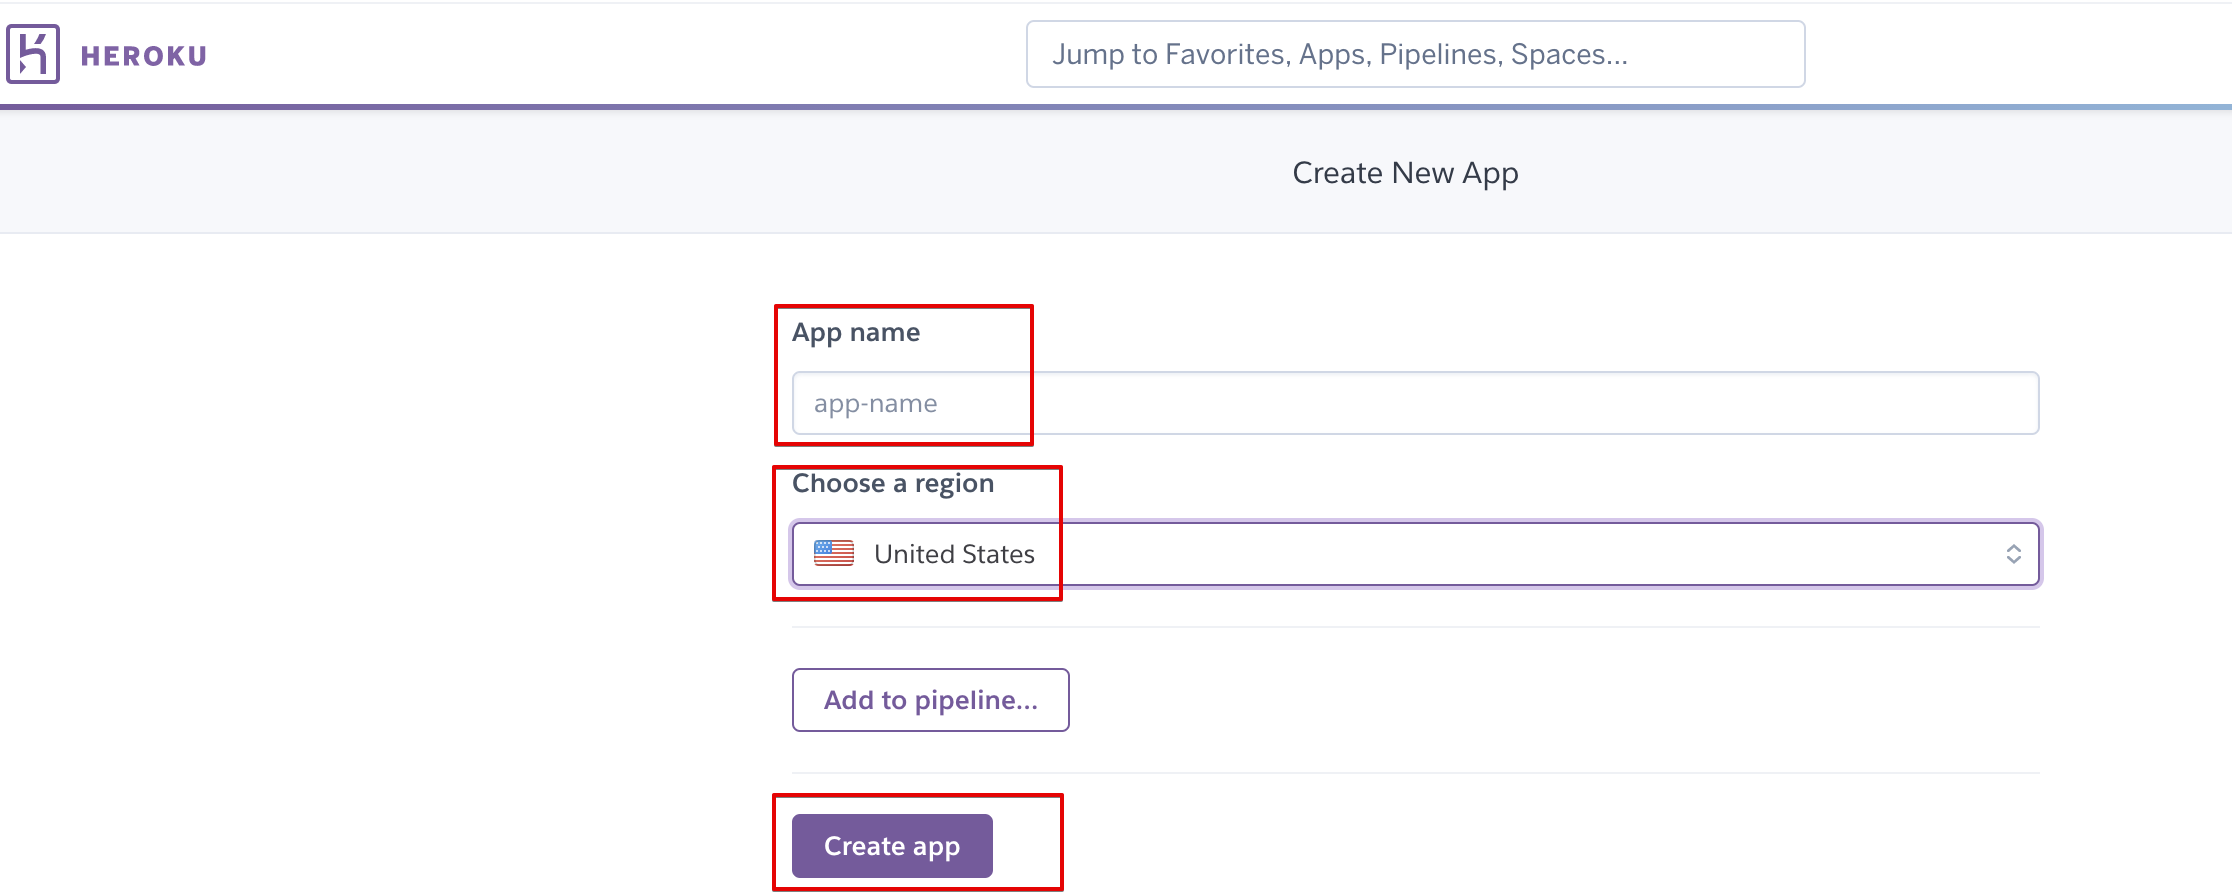
- Login to your Heroku account and Create a new app.

- Choose a unique App name, leave region as United States, and click on Create App. My chosen name:
model-scoring-evidently-demo.
- In the Deployment method section, select Github - Connect to GitHub. In the Connect to GitHub section, search and connect to your repository.
Note: This should be the forked repository, and NOT the original Udacity repository for this tutorial.

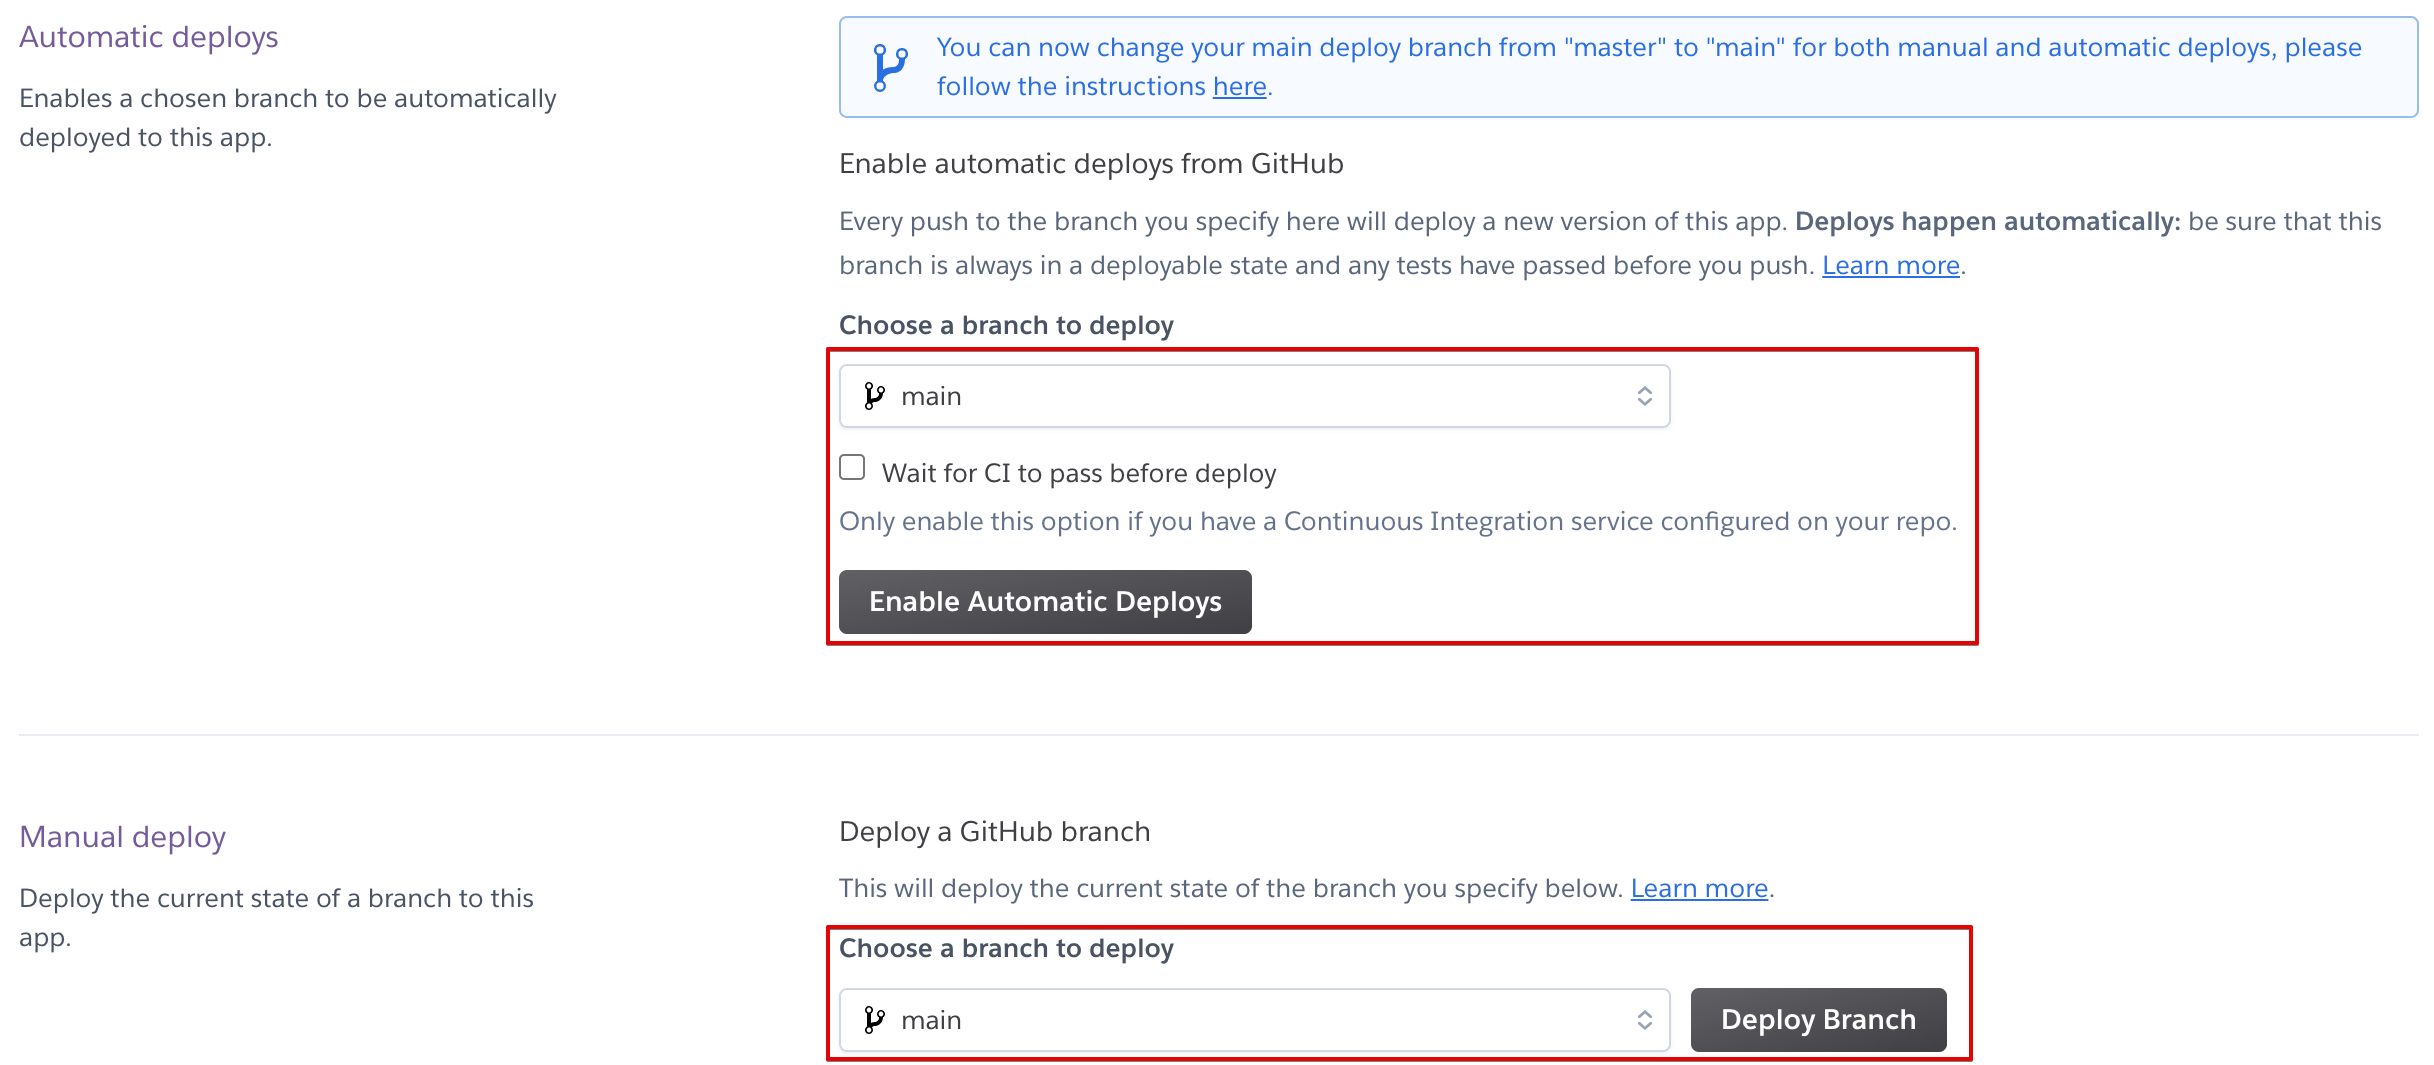
- In the Automatic deploys section, select main as the branch you want to deploy (unless you have created some other branch), and click on Enable Automatic Deploys. Finally, click on Deploy Branch.

- Click on open app or navigate to
name-of-your-app.herokuapp.comto see the Regression Model Performance Report.Note: Replace name-of-your-app with the name you set in Step 1.

- To see the data drift dashboards generated by Evidently, navigate to
name-of-your-app.herokuapp.com/target_drift_after_week1.html. Replace week1 with week2 in the url above to see data drift after week 2.

