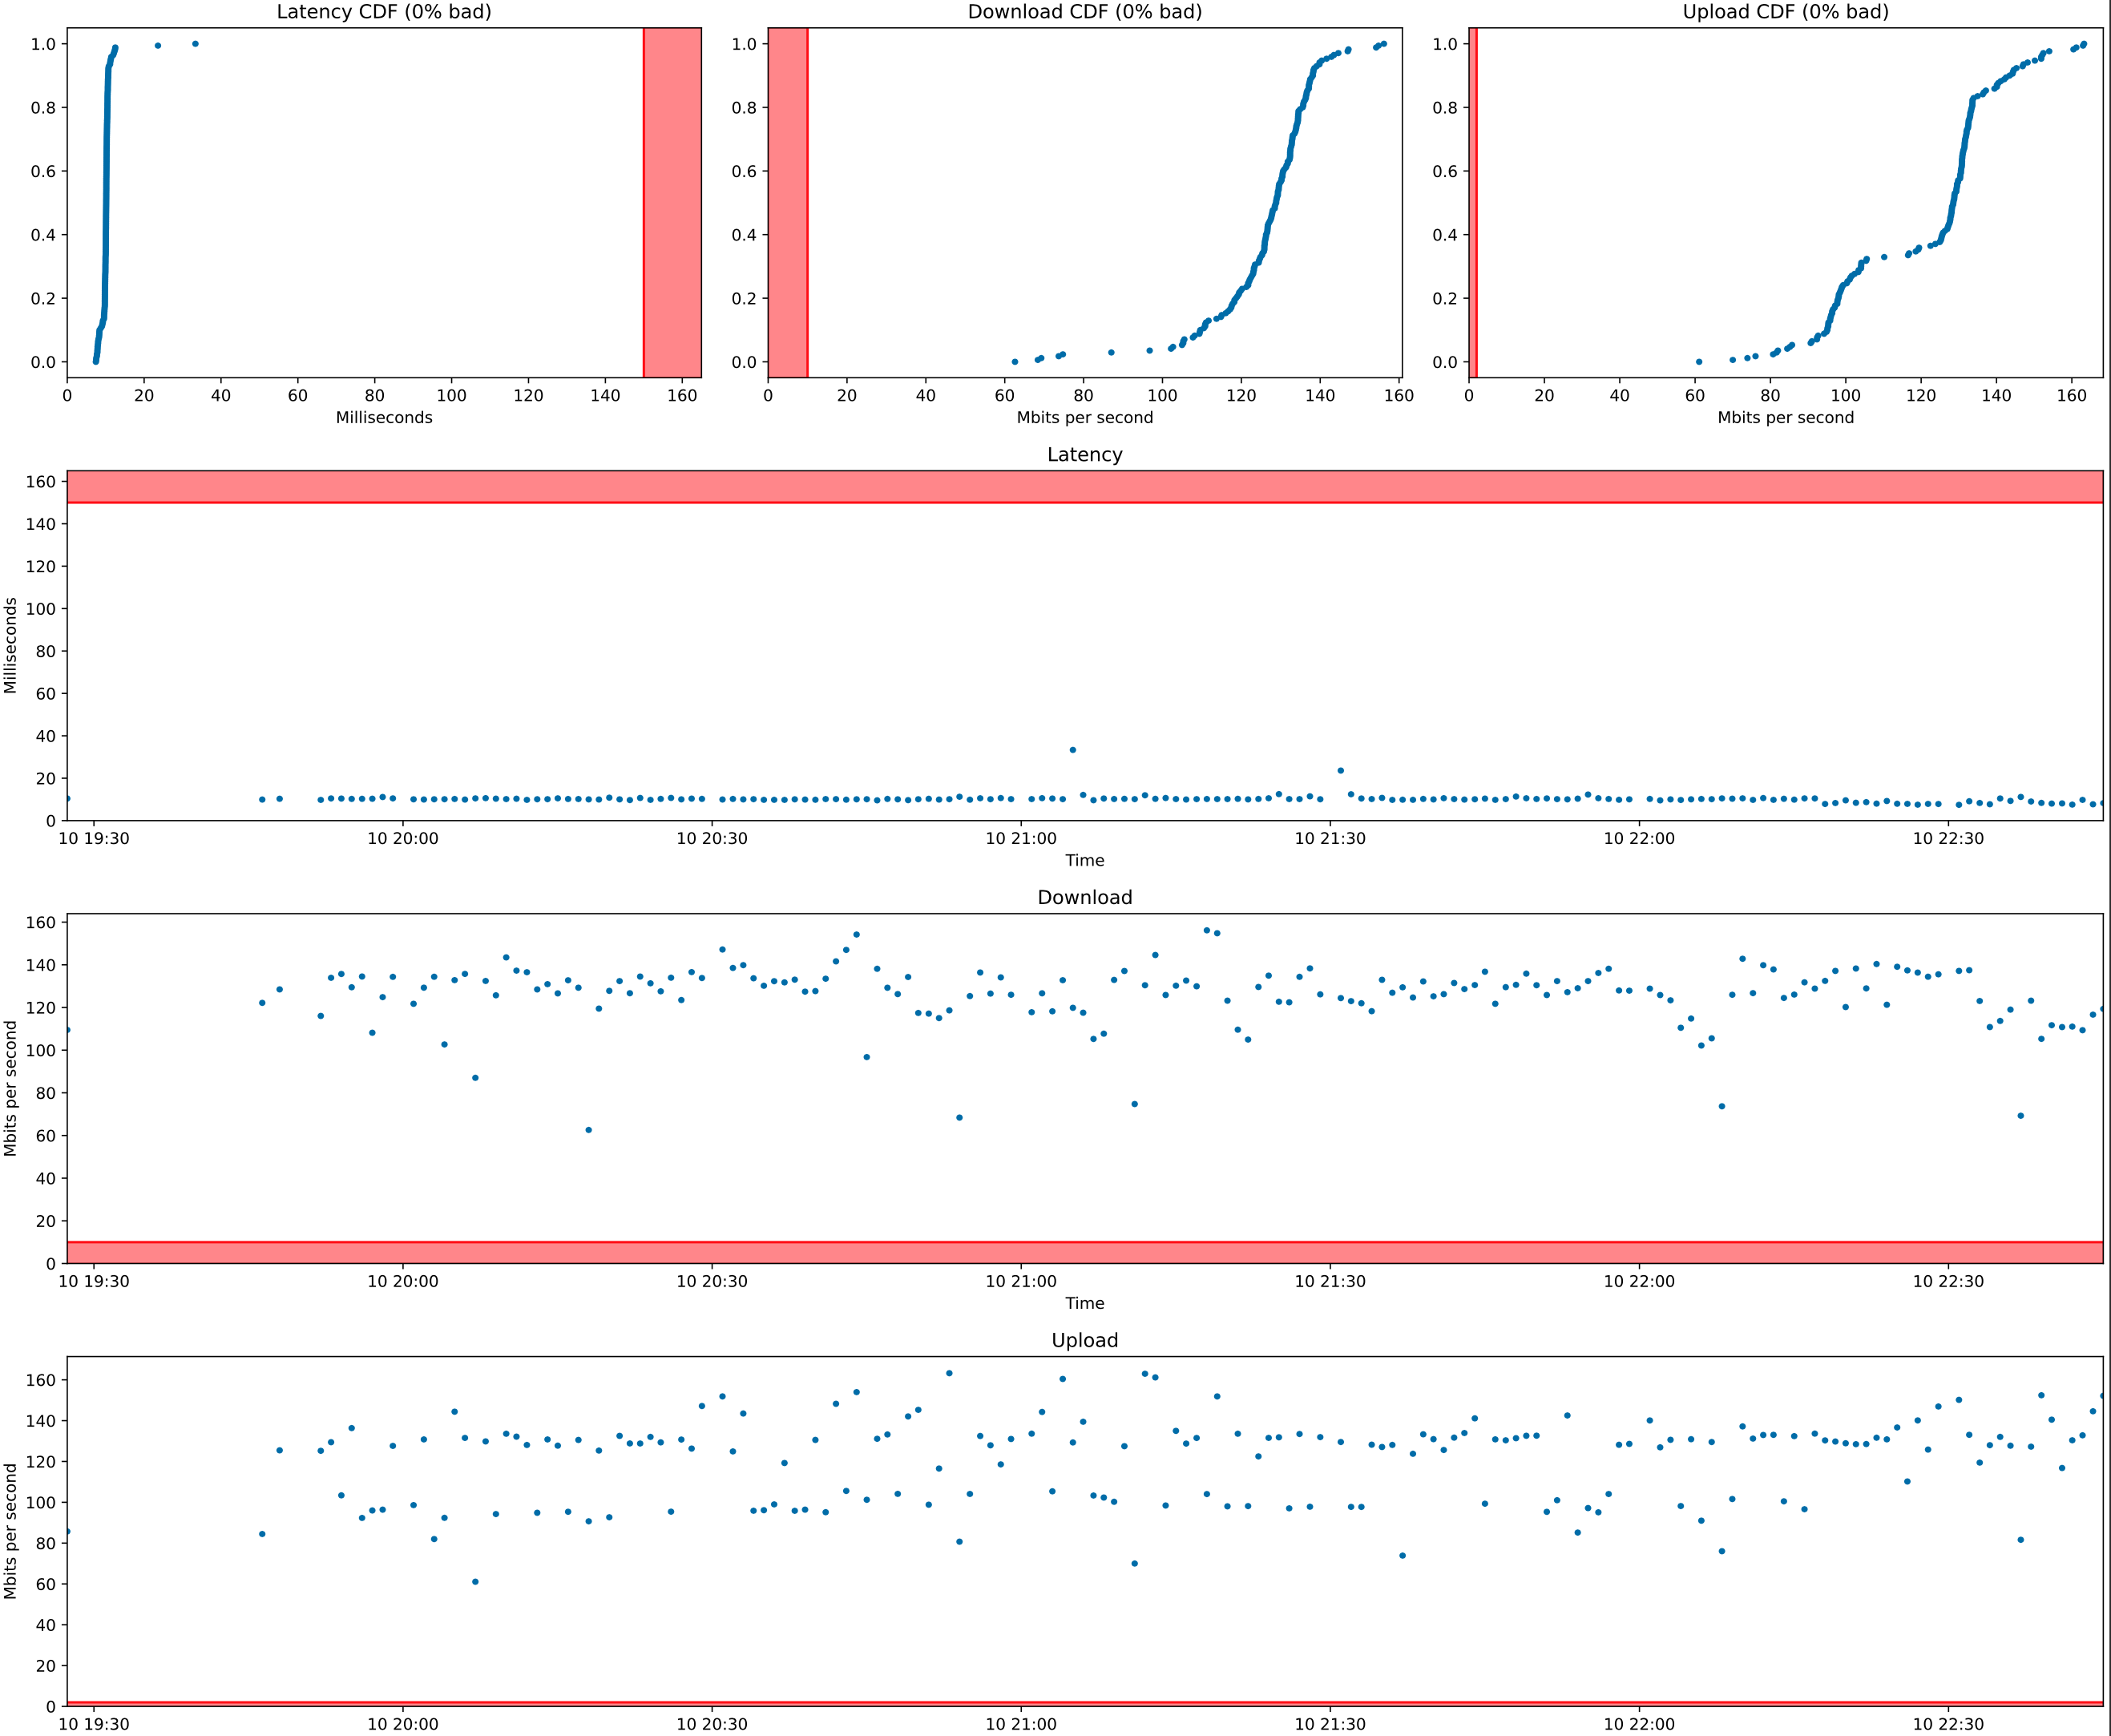
This is a tool that will measure and report metrics relevant to internet usage: download bandwidth, upload bandwidth, and latency. The tool gathers metrics by running a speedtest on speedtest.net for each minute the computer is awake.
This data is aggregated and reported as a single pdf with cummulative density (CDF) and timeseries summaries for each metric:
The advantage of this tool over a speedtest is that the data is aggregated across an arbitrary amount of time. This can help you convince your ISP that you actually do have a problem, even when the ISP operator comes to your home and the internet randomly happens to be working when they are there.
Dependencies: python3, matplotlib, csv, datetime, numpy
Install the python client to [speedtest.net].
Add a cronjob to run the speedtest every minute by running crontab -e and adding
the folowing line to the end of the file:
* * * * * /usr/local/bin/speedtest --csv 2>>~/speedtest.err 1>>~/speedtest.csv
(Make sure the file has an empty line at the end.)
Generate up-to-date graphs by running:
python3 plot_speedtest.py
This will create a speedtest.pdf file in this repo's plots folder.
If you want to generate the report only for the last N minutes, run:
python3 plot_speedtest.py N
