BowieMobility is a data analysis project aiming to gather data about battery electric vehicles (BEV) as well as charging points for them in Germany. In a next step, features of interest within these data are visualized by plotting a selection of these data.
- Initial Contributors
- The Data Sources
- Research questions and possible insights
- Workflow
- Usage
- Contributing
- License
- Links
Team "Bowie":
dataset 1: a collection of all electric vehicle charging points in Germany with various column names such as type of charger, address of the charger, how much power can it deliver, date of going online. It is provided by the Bundesnetzagentur in .xlsx or .csv format
dataset 2, is a dataset for charging sessions that spans the past 30 days and is obtained via a standard http-call API which the Federal Government of Germany created together with the company Plugsurfing. Of this dataset, we make use of the partial usage of each electric vehicle model and plot this later to get an impression, which car model is charged most often.
dataset 3: yearly (2009-2018) data for all newly registered electric vehicles in Germany. These are provided by the "Kraftfahrtbundesamt" in form of an .html-table.
The project intented to shed light on one or more of the following questions:
-
does the building of electric charging infrastructure in Germany keep track with the registrations of electric vehicles? Which boils down to plotting to graphs in one figure.
-
are impacts from external influences (political decisions, economical ups/downs, Coronavirus) on both observables apparent?
Possible future analysis:
- Several other statistics: What are the most charged BEV models? What percentage is loaded mostly (90%, 80%? that is, at what point of battery power remaining do drivers drive to a charging point?), Distribution of charging points by ZIP code, histogram of charging points providable power / developement of that and other values over time etc. etc.
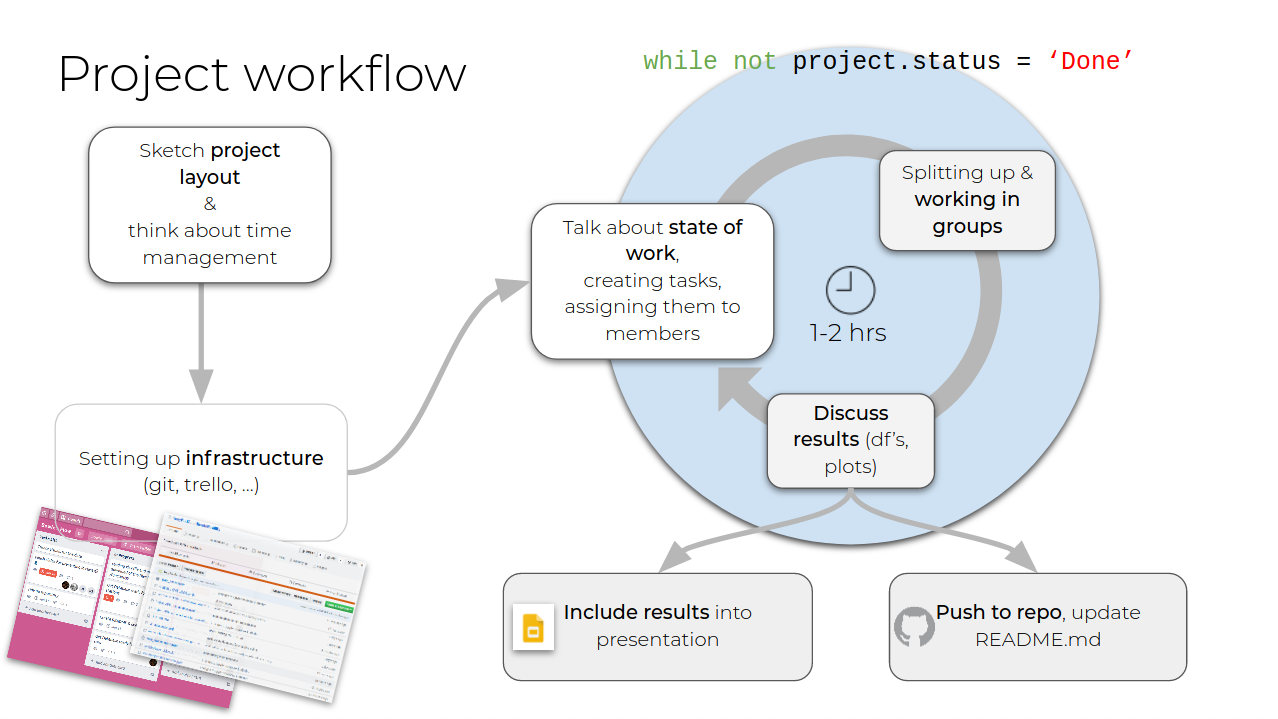
We have visualized our workflow with the following diagram
Execute the main_bowiemobility.ipynb and inspect it for the data analysis as it is presented there. The notebook stores .pickle-Files for each dataframe in the ./data folder.
Pull requests are welcome. For major changes, please open an issue first to discuss what you would like to change.
Please make sure to update tests as appropriate.
