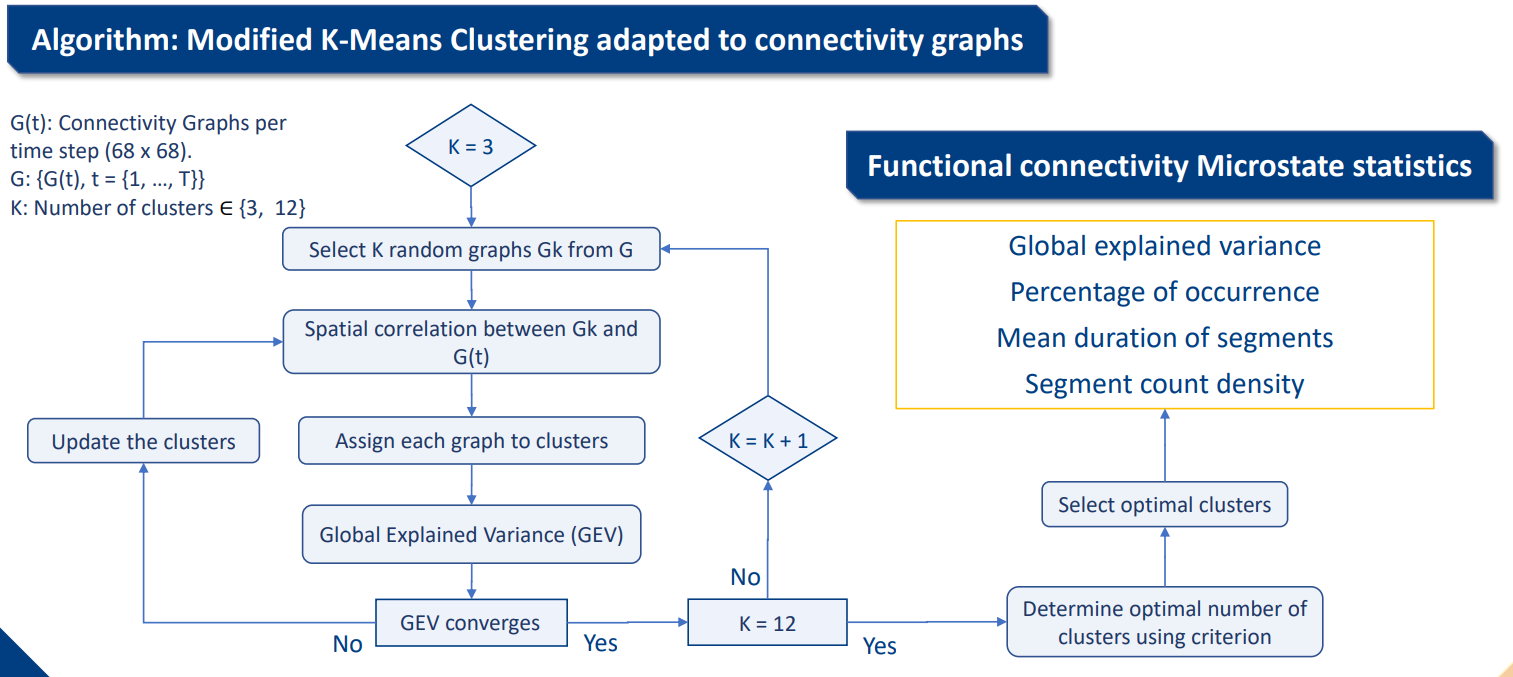
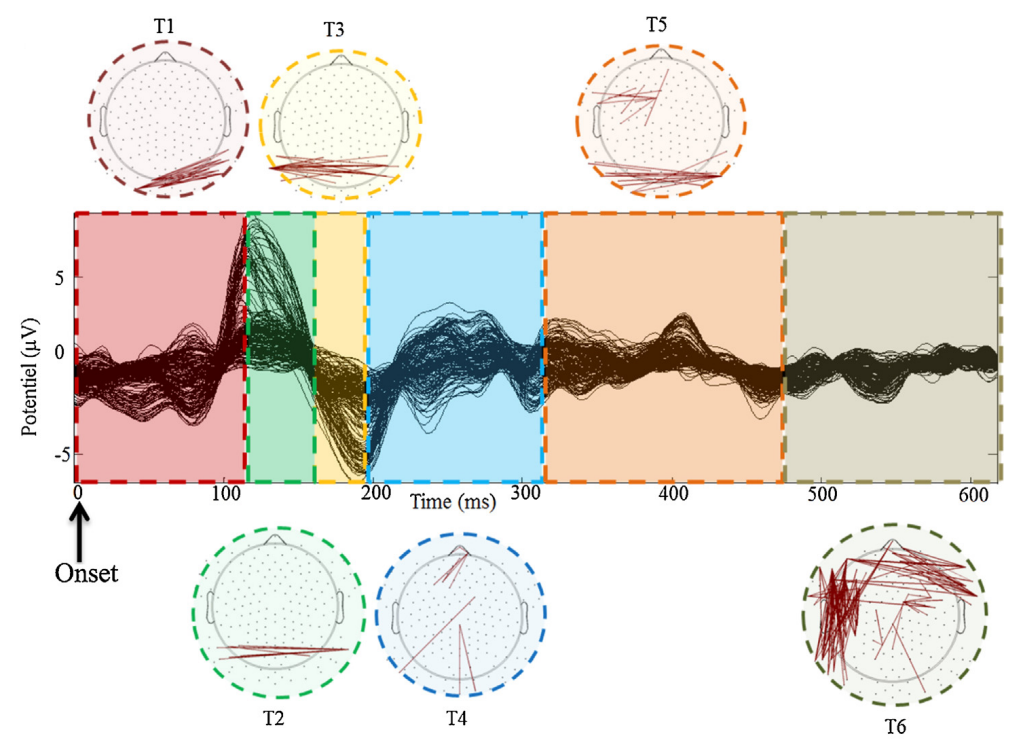
Python library to track the spatiotemporal dynamics of brain network based on a modified k-means clustering algorithm [1] adapted to EEG connectivity graphs with a methodology similar to [2] (see Figure 1 and Figure 2).
In order to identify the different clusters sequentially involved in the cognitive process, the algorithm aims at
identify and segment the connectivity microstates [3][4].
Initialise a number of cluster, select randomly K connectivity graphs (aka adjacent matrices) Gk, compute the spatial correlation between them and every others matrices from the connectivity graph pool.
Each graph are assigned to cluster with which they had been the most correlated. Update the centroids of the clusters by taking the mean graph of all assigned graph until the global explained variance (GEV) explained by each cluster (for a certain K) converges.
Use a criterion like the cross validation criterion which is a ratio GEV to number of clusters to determine a good trade-off between variance explained and number of clusters.
git clone https://github.com/nabilalibou/connectivity_segmentation.git
pip install -r requirements.txt
connectivity-segmentation relies on 2 convenient classes:
connectivity_segmentation.kmeans.ModKMeans
connectivity_segmentation.segmentation.Segmentation
We start by fitting the modified kmeans algorithm to a dataset using
the ModKMeans.fit() method before the ModKMeans.predict() method which will return the microstate Segmentation object.
The segmentation can be visualised using the method segmentation.Segmentation.plot().
The package implement other methods and functions to compute, visualise and save various metrics and statistics to evaluate the clustering solution.
Note: The Segmentation class is an adaptation of the _BaseSegmentation class from the library pycrostate [5] (https://github.com/vferat/pycrostates, Copyright (c) 2020, Victor Férat, All rights reserved.)
[1] Pascual-Marqui RD, Michel CM, Lehmann D. Segmentation of brain electrical activity into microstates: model estimation and validation. Biomedical Engineering, IEEE Transactions on. 1995; 42:658–665
[2] Mheich, A.; Hassan, M.; Khalil, M.; Berrou, C.; Wendling, F. (2015). A new algorithm for spatiotemporal analysis of brain functional connectivity. Journal of Neuroscience Methods, 242(), 77–81. doi:10.1016/j.jneumeth.2015.01.002
[3] Christoph M. Michel and Thomas Koenig. Eeg microstates as a tool for studying the temporal dynamics of whole-brain neuronal networks: a review. NeuroImage, 180:577–593, 2018. doi:10.1016/j.neuroimage.2017.11.062.
[4] Micah M. Murray; Denis Brunet; Christoph M. Michel (2008). Topographic ERP Analyses: A Step-by-Step Tutorial Review. , 20(4), 249–264. doi:10.1007/s10548-008-0054-5
[5] Victor Férat, Mathieu Scheltienne, rkobler, AJQuinn, & Lou. (2023). vferat/pycrostates: 0.4.1 (0.4.1). Zenodo. https://doi.org/10.5281/zenodo.10176055

