This is a repository containing the methodology for some experiments used to evaluate one aspect of container isolation: the attack surface to the host kernel. More specifically, these experiments measure how many kernel functions are accessed by an application as it runs and how complex those functions are.
The script runtest.bash performs a run of a test on one of the
Docker containers that we have provided in the
nabla-demo-apps
repository. Currently this consists of:
- node-express: a node.js express application
- redis-test: a redis key/value server
- python-tornado: a Python tornado web server
Each run of runtest.bash sets up the kernel ftrace facility, runs
the container, turns on tracing for the relevant pids, offers load,
cleans up and processes the results. The raw and processed output
ends up in a directory for later perusal.
The easiest way to replicate a test is to run commands of the form
./runtest.bash <RUNTIME> <CONTAINER> <OUTPUT_DIR>. RUNTIME can
currently be runc (default docker), runnc (nabla), kata (kata
containers), katafc (kata containers with firecracker), runsc
(gvisor), or runsck (gvisor in kvm mode), and CONTAINER is one of
those specified above. Here are some examples:
sudo ./runtest.bash runc nablact/node-express results/docker-node-express
sudo ./runtest.bash runnc nablact/node-express results/nabla-node-express
sudo ./runtest.bash kata nablact/node-express results/kata-node-express
sudo ./runtest.bash katafc nablact/node-express results/katafc-node-express
sudo ./runtest.bash runsc nablact/node-express results/gvisor-node-express
sudo ./runtest.bash runsck nablact/node-express results/gvisork-node-express
We inform the Docker daemon of the alternate runtimes by adding them
to /etc/docker/daemon.json (as also described in the runnc
repository):
"runtimes": {
    "runnc": {
        "path": "/usr/local/bin/runnc"
    },
    "kata": {
        "path": "/usr/bin/kata-runtime"
    },
    "runsc": {
        "path": "/usr/local/bin/runsc"
    },
    "runsck": {
        "path": "/usr/local/bin/runsc",
        "runtimeArgs": [
            "--platform=kvm"
        ]
    }
}
Note that in order to use kata with firecracker (katafc), there is a
dependency on devicemapper that requires a particular (old) version of
Docker. For more information, see this
link.
As a result, the above file needs further specification:
"runtimes": {
    "storage-driver": "devicemapper",
    "runnc": {
        "path": "/usr/local/bin/runnc"
    },
    "kata": {
        "path": "/usr/bin/kata-runtime"
    },
    "katafc": {
        "path": "/opt/kata/bin/kata-fc"
    },
    "runsc": {
        "path": "/usr/local/bin/runsc"
    },
    "runsck": {
        "path": "/usr/local/bin/runsc",
        "runtimeArgs": [
            "--platform=kvm"
        ]
    }
}
For ease of measurement, we do not measure the startup coverage of the
containers, thus we need containers that are long-running enough to
give the tracing enough time to turn on. Partially this is because of
how we gather the relevant pids. This is done by looking through
pstree for all the children of the docker-containe command
specifying the -runtime-root, which is either runtime-runc (in the
default case), runtime-runnc (in the nabla case), runtime-kata (in
the kata containers case) or runtime-runsc (in the gvisor case).
During the experiments, we pin all container runtime pids to core 0,
to avoid confusing the function trace if a pid were to switch cores.
We also process the raw traces primarily to eliminate interrupts,
which may perform work on behalf of other processes. There are three
filtering programs, written in C, in the filters/ directory to aid
in removing interrupt-related functions from the raw trace. See the
README in that directory for more information.
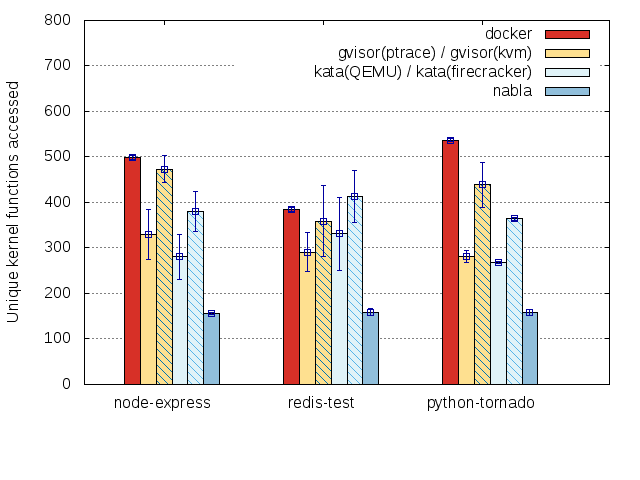
Once filtering and processing is complete, a list of the unique
functions called should appear in OUTPUT_DIR/trace.list. Counting
the lines in this file will give a count of the unique functions.
Alternately, grepping for functions starting with sys will show the
system calls (e.g., grep -i "^sys\_")
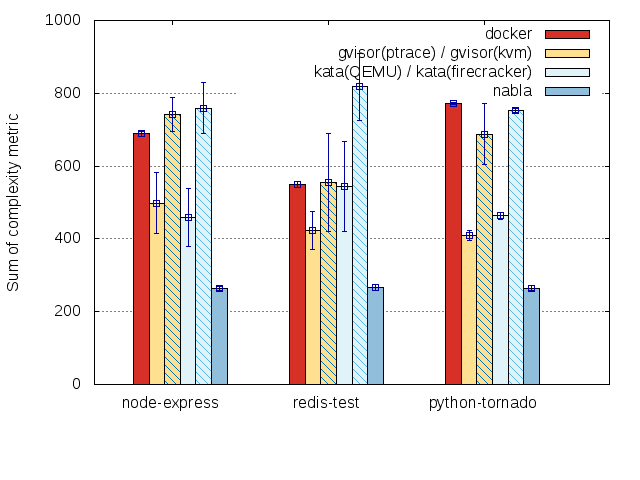
To get a sense of how complex the unique functions are, we also
perform a complexity analysis using the GNU complexity tool. We run
complexity over the kernel version we used (sample output is included
in this repository in the file named ./complexity). Then, we
use those numbers to compute a total complexity sum for each case.
We have included some results for default docker, nabla, kata, and
gvisor containers that were obtained using the graphs_generate.bash
script.