Embedded Development on STM32 with CLion and the Segger Tools
The CLion IDE from Jetbrains is a very powerful IDE for C/C++ developments with lots of features to increase developer productivity. This small demo project shows how to use CLion for embedded development. The Tools used are the nucleo- board from ST but the approach should work on any platform with a gcc compiler, a gdb debugger and a gdbserver on the target or on some sort of JTAG- Probe. This demo project is heavily based on the Blog Post of Ilya Motornyy on the CLion blog.
There are some dependencies that have to be satisfied to build and run the demo.
In this demo we assume running all our tools on a Windows host.
On Windows hosts, CMake expects MINGW running on the host to have the make utility available. Install a minimal MINGW Environment from this location.
After installation, test the MINGW environment by typing
mingw32-make
in a terminal.
There should be a result similar to
mingw32-make: *** No targets specified and no makefile found. Stop.
Download and install the CLioin IDE from Jetbrains. There ist a free 30 Day evaluation licence available.
A gcc based cross- tool- chain for ARM microcontrolers can be obtained free of charge directly from ARM.
Install the Toolchain for the windows host.
After installing, check if the tools are available on your PATH: Open a terminal and type
arm-none-eabi-gcc
There should be some response like
arm-none-eabi-gcc: fatal error: no input files
compilation terminated.
If this is not the case, you have to append the bin directory of the toolchain to your PATH and test again.
The JLink gdb-server ist part of the Software- Tools from Segger. Download and install the latest version from here.
You need a STM nucleo Board from STM. To be used with the Segger JLink- Tools, the firmware on the debug- part of the nucleo- board has to be changed according to this description.
After the firmware change, the debug- part of the nucleo behaves like a SEGGER J-Link debug probe.
To test the Jlink gdbserver we have to open a terminal and run the SEGGER J-Ling gdbserver in cli- Mode configured for our microcontroller.
If the SEGGER tools are installed at the default location,
"C:\Program Files (x86)\SEGGER\JLink\JLinkGDBServerCL.exe" -select USB -device STM32L476RG -if SWD -speed 1000 -ir
starts the Jlink gdbserver in CLI- Mode (without GUI) configured for the microcontroller on the nucleo board and connects to the microcontroller core. If everything is fine you should see an output similar to
SEGGER J-Link GDB Server V6.12d Command Line Version

JLinkARM.dll V6.12d (DLL compiled Dec 21 2016 16:56:08)

-----GDB Server start settings-----
GDBInit file:                  none
GDB Server Listening port:     2331
SWO raw output listening port: 2332
Terminal I/O port:             2333
Accept remote connection:      localhost only
Generate logfile:              off
Verify download:               off
Init regs on start:            on
Silent mode:                   off
Single run mode:               off
Target connection timeout:     0 ms
------J-Link related settings------
J-Link Host interface:         USB
J-Link script:                 none
J-Link settings file:          none
------Target related settings------
Target device:                 STM32L476RG
Target interface:              SWD
Target interface speed:        1000kHz
Target endian:                 little

Connecting to J-Link...
J-Link is connected.
Firmware: J-Link STLink V21 compiled Dec 21 2016 15:10:59
Hardware: V1.00
S/N: 770548980
Checking target voltage...
Target voltage: 3.30 V
Listening on TCP/IP port 2331
Connecting to target...Connected to target
Waiting for GDB connection...
This shows you the gdbserver is ready to accept connections on port 2331.
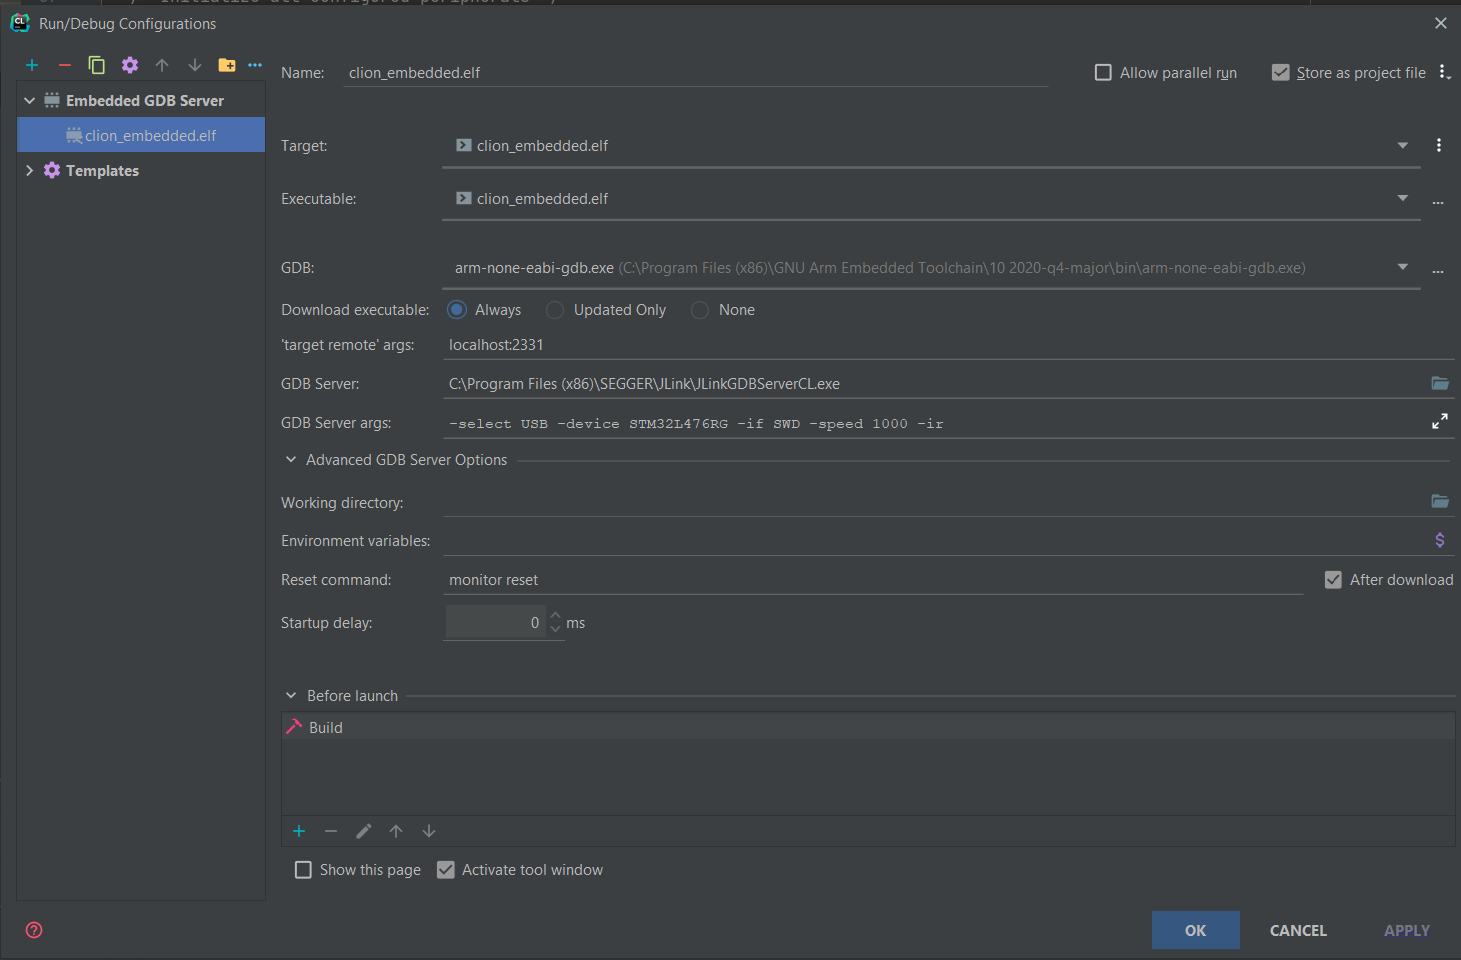
In Clion configure a new Embedded GDBServer Run / Debug configuration:

This Run- Configuration- Type supports a Build- Step before the debugging session so you can build and debug with a single SHIFT F9 Keystroke.
By default gdb loads the .gdbinit from %HOMEPATH%. To change this behaviour there has to be a .gdbinit with the following content in %HOMEPATH%:
set auto-load local-gdbinit on
add-auto-load-safe-path /
This tells CLion to use the .gdbinit- file in the project root.
As an example this project contains a .gdbinit file setting a breakpoint at main() when the executable was loaded onto the target.
The debugger component in CLion can show the peripheral registers of the microcontroller when provided an appropriate *.svd file describing the peripherals. The description files can be found on the website of the chip vendors, in our case STMicroelectronics
The microcontroller on our demo board is from the STM32L4x6 family so the STM32L4x6.svd file is necessary. After
adding this file to the project root and configuring it in the Peripherals Tab on the debugger view, the actual state
of the microcontroller peripherals can be examined.
