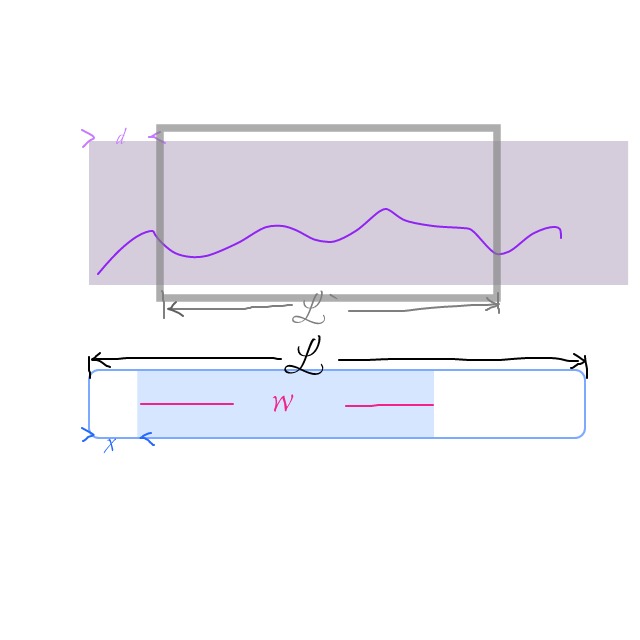
This repository will show you how to make a simple timeline with SVG 😃
See the demo 👉🏻here
1️⃣ Create an SVG element;
2️⃣ Define a clippath inside this SVG;
3️⃣ Draw data-display path for your data display;
4️⃣ Draw grid (x & y);
5️⃣ Draw controllers (two small scrollbars and a mask) inside a group;
6️⃣ Write JavaScript to make controllers move!
scrollbars 👉🏻 "single move" 👉🏻 only change relative translate transform.
mask 👉🏻 "group move" 👉🏻 change absolute translate transform.
While moving, calculate translate and scale value for data-display area to make it move accordingly!
rate = w / L
dataVisible length = rate * dataLength
dataInvisible length = - x * dataLength / L

assume the dataLength after scaling is L1, we get:
w / L = L` / L1
so scale = L1 / dataLength =  L` / (rate * dataLength)
so d = dataInvisible length * scale
