The output of all methods is combined in the R/comparison.R script.
It solves the acid-base equations for a given Na concentration, in a phosphoric acid buffer.
R/phosphoric_titration_numeric.R implements the numerical method, and was run with R version 4.0.4, and nleqslv version 3.3.2.
Thanks to Bhas for helping with that at stackoverflow: https://stackoverflow.com/a/66883518/11524079
The result is saved for convenience and reference in the output/result.df.RDS file (and others, similarly named).
Everything relevant in a plot :)
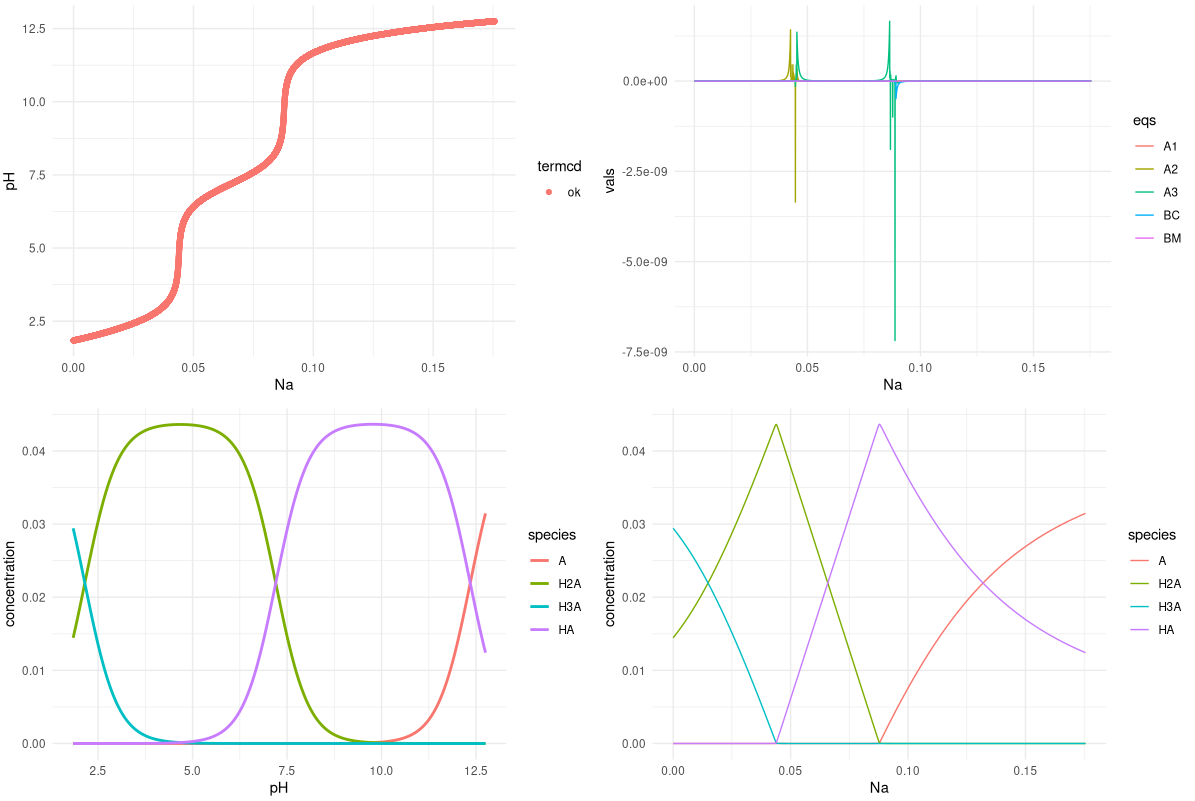
Titration curve (top left); values of objective functions (top right, BM: mass balance, BC: charge balance, An: acid-base equilibria); speciation diagram (bottom left) and a nice Na VS species plot which I never saw in class (bottom right).
R/phosphoric_titration_analytic.R implements the analytical method explained by Poutnik at: https://chemistry.stackexchange.com/a/149285/107836
Very simple and elegant: solving for Na is much simpler than solving for pH.
It took me 10 minutes to implement Poutnik's solution (while learning how to use numerical solvers took me days).
Moraleja: KISS :P
Implementation of a way of adjusting for titrant volume addition, in the R/phosphoric_titration_analytic.vol_correct.R script. Complements Poutnik's answer.
First, the script solves for [Na+] without corrections. Then uses it to update total volume and acid concentrarion. This calculation is repeated until convergence (see Na.adj.one(); tol = 1e-8).
- I still have to check if it really converges to where it's supposed to. Poutnik suggested other methods.
- I still have to find out why it converges xD.
I also solved the corrected version analitically, and it matches perfectly (see Na.adj.analitico() and the plots below).
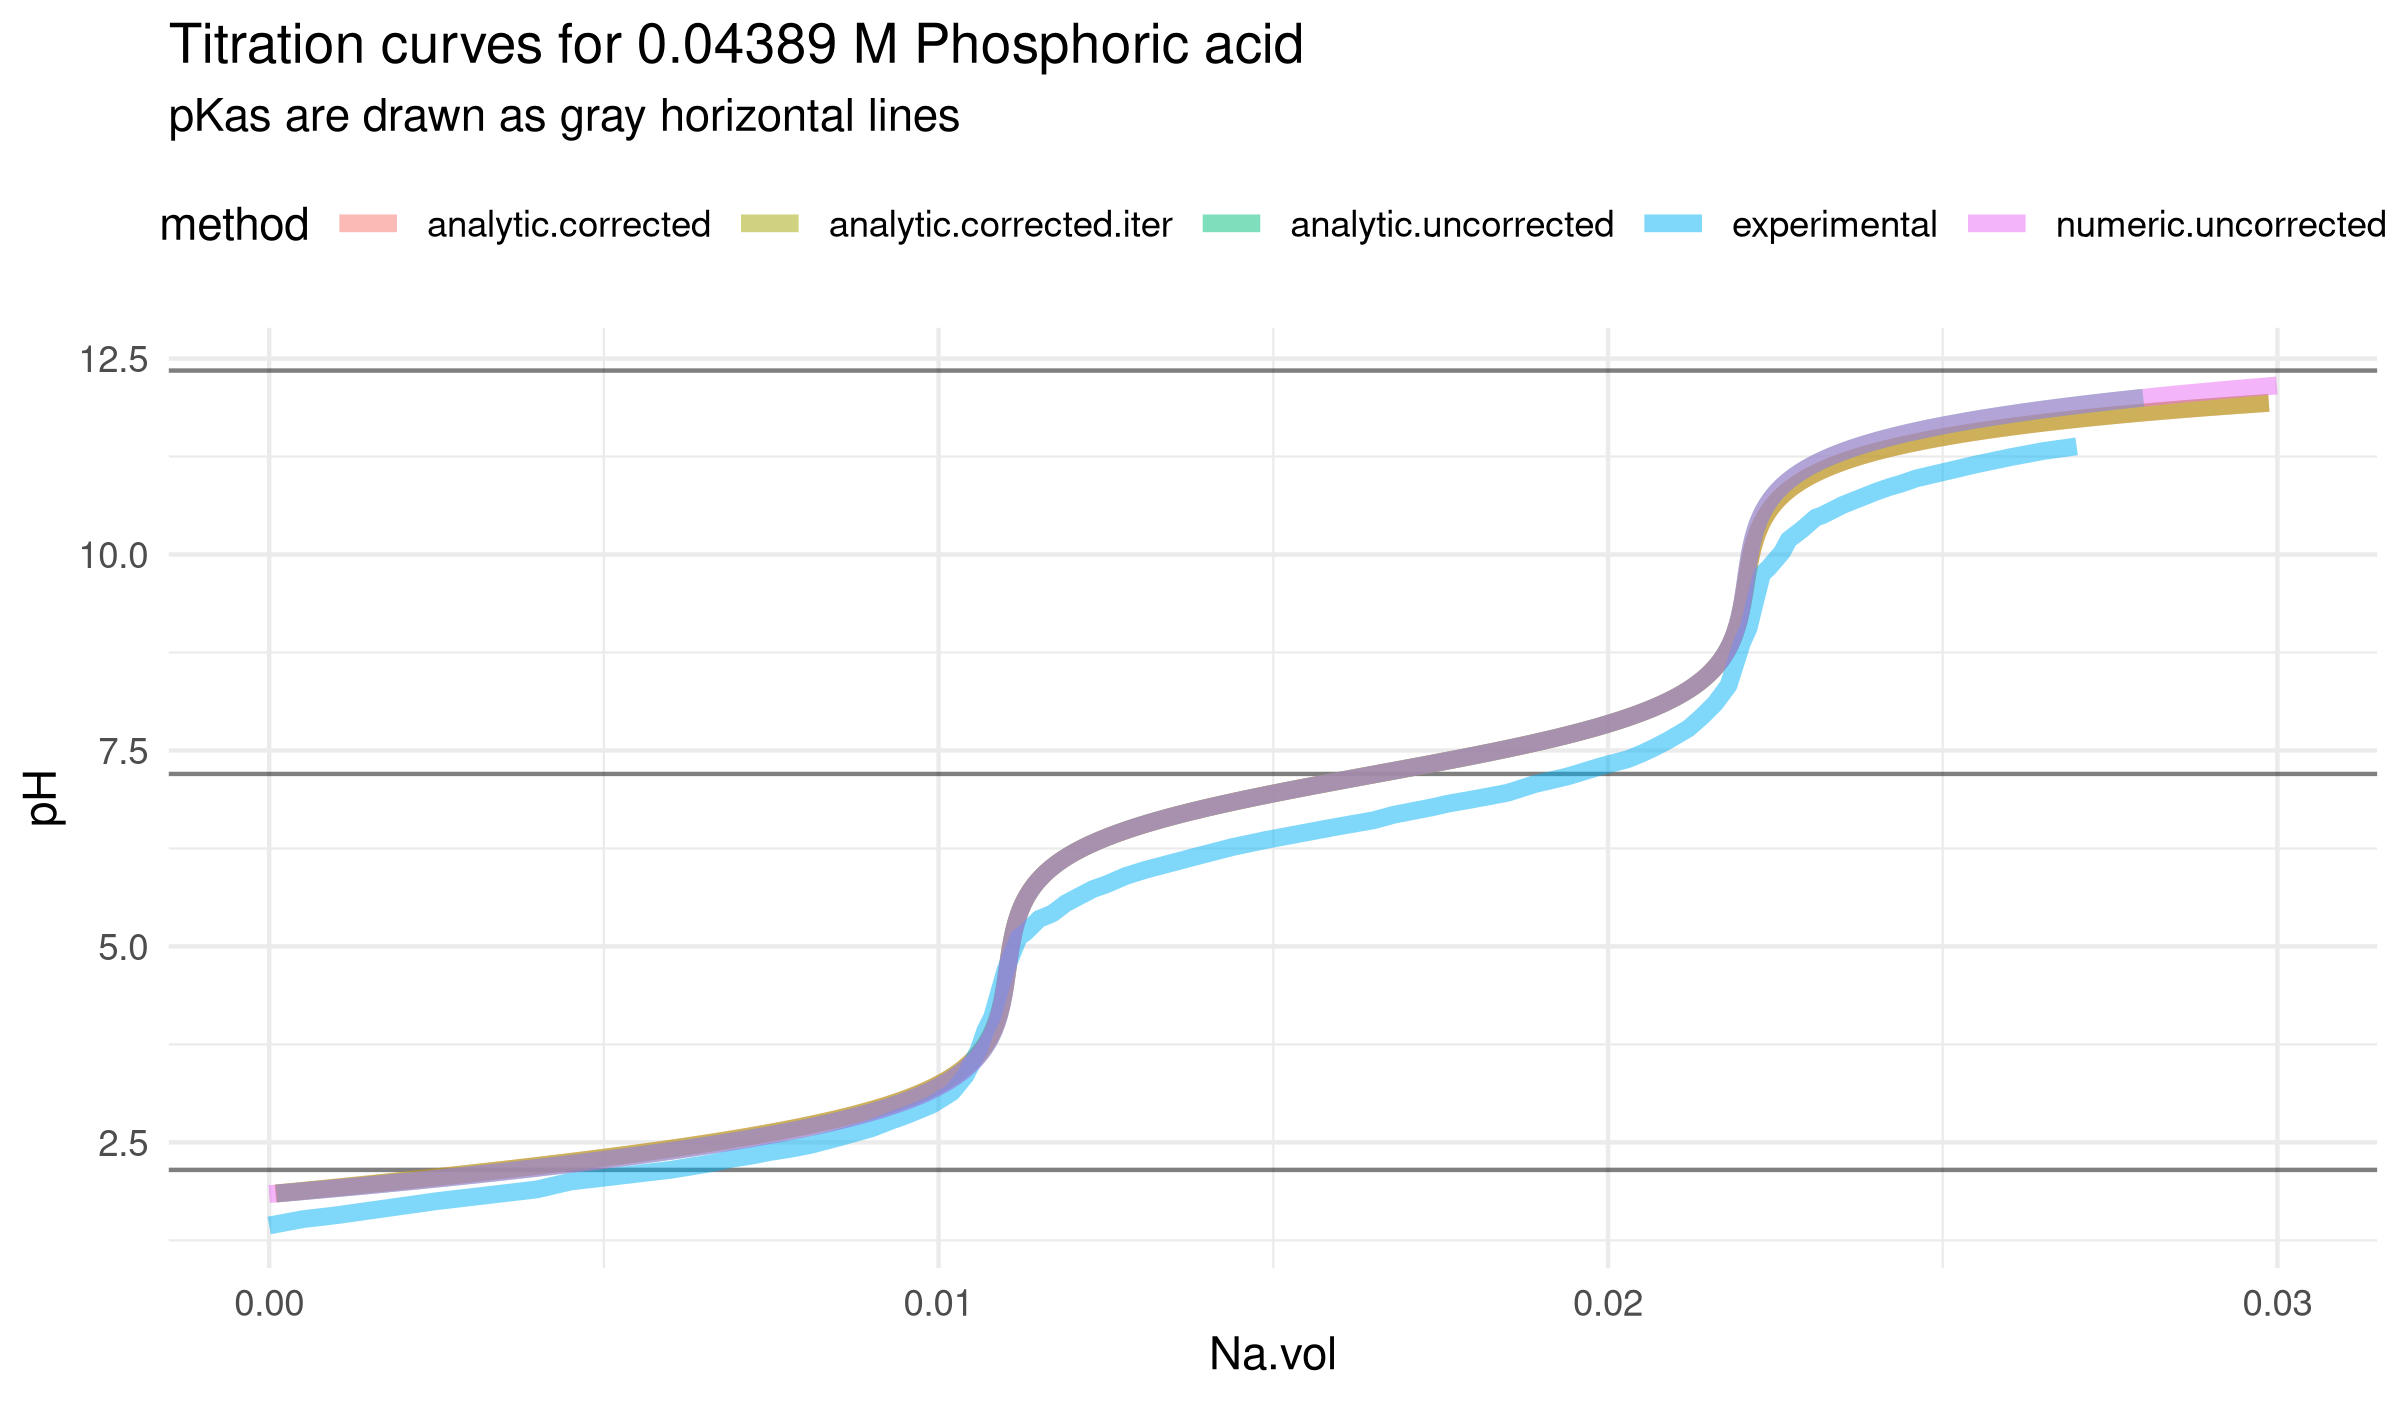
Code for comparison to experimental data (from Julia Martín et al, DOI 10.20431/2349-0403.0409002) is at R/comparison.R.
Note: the "iterative" volume correction to the volume-uncorrected analytical solution has some trouble converging in the conditions of the real experiment. But works in test conditions or with more iterations.
The volume-corrected analytical solution also struggles in these conditions, and the top pH had to be set below 12.
Well, its something!

