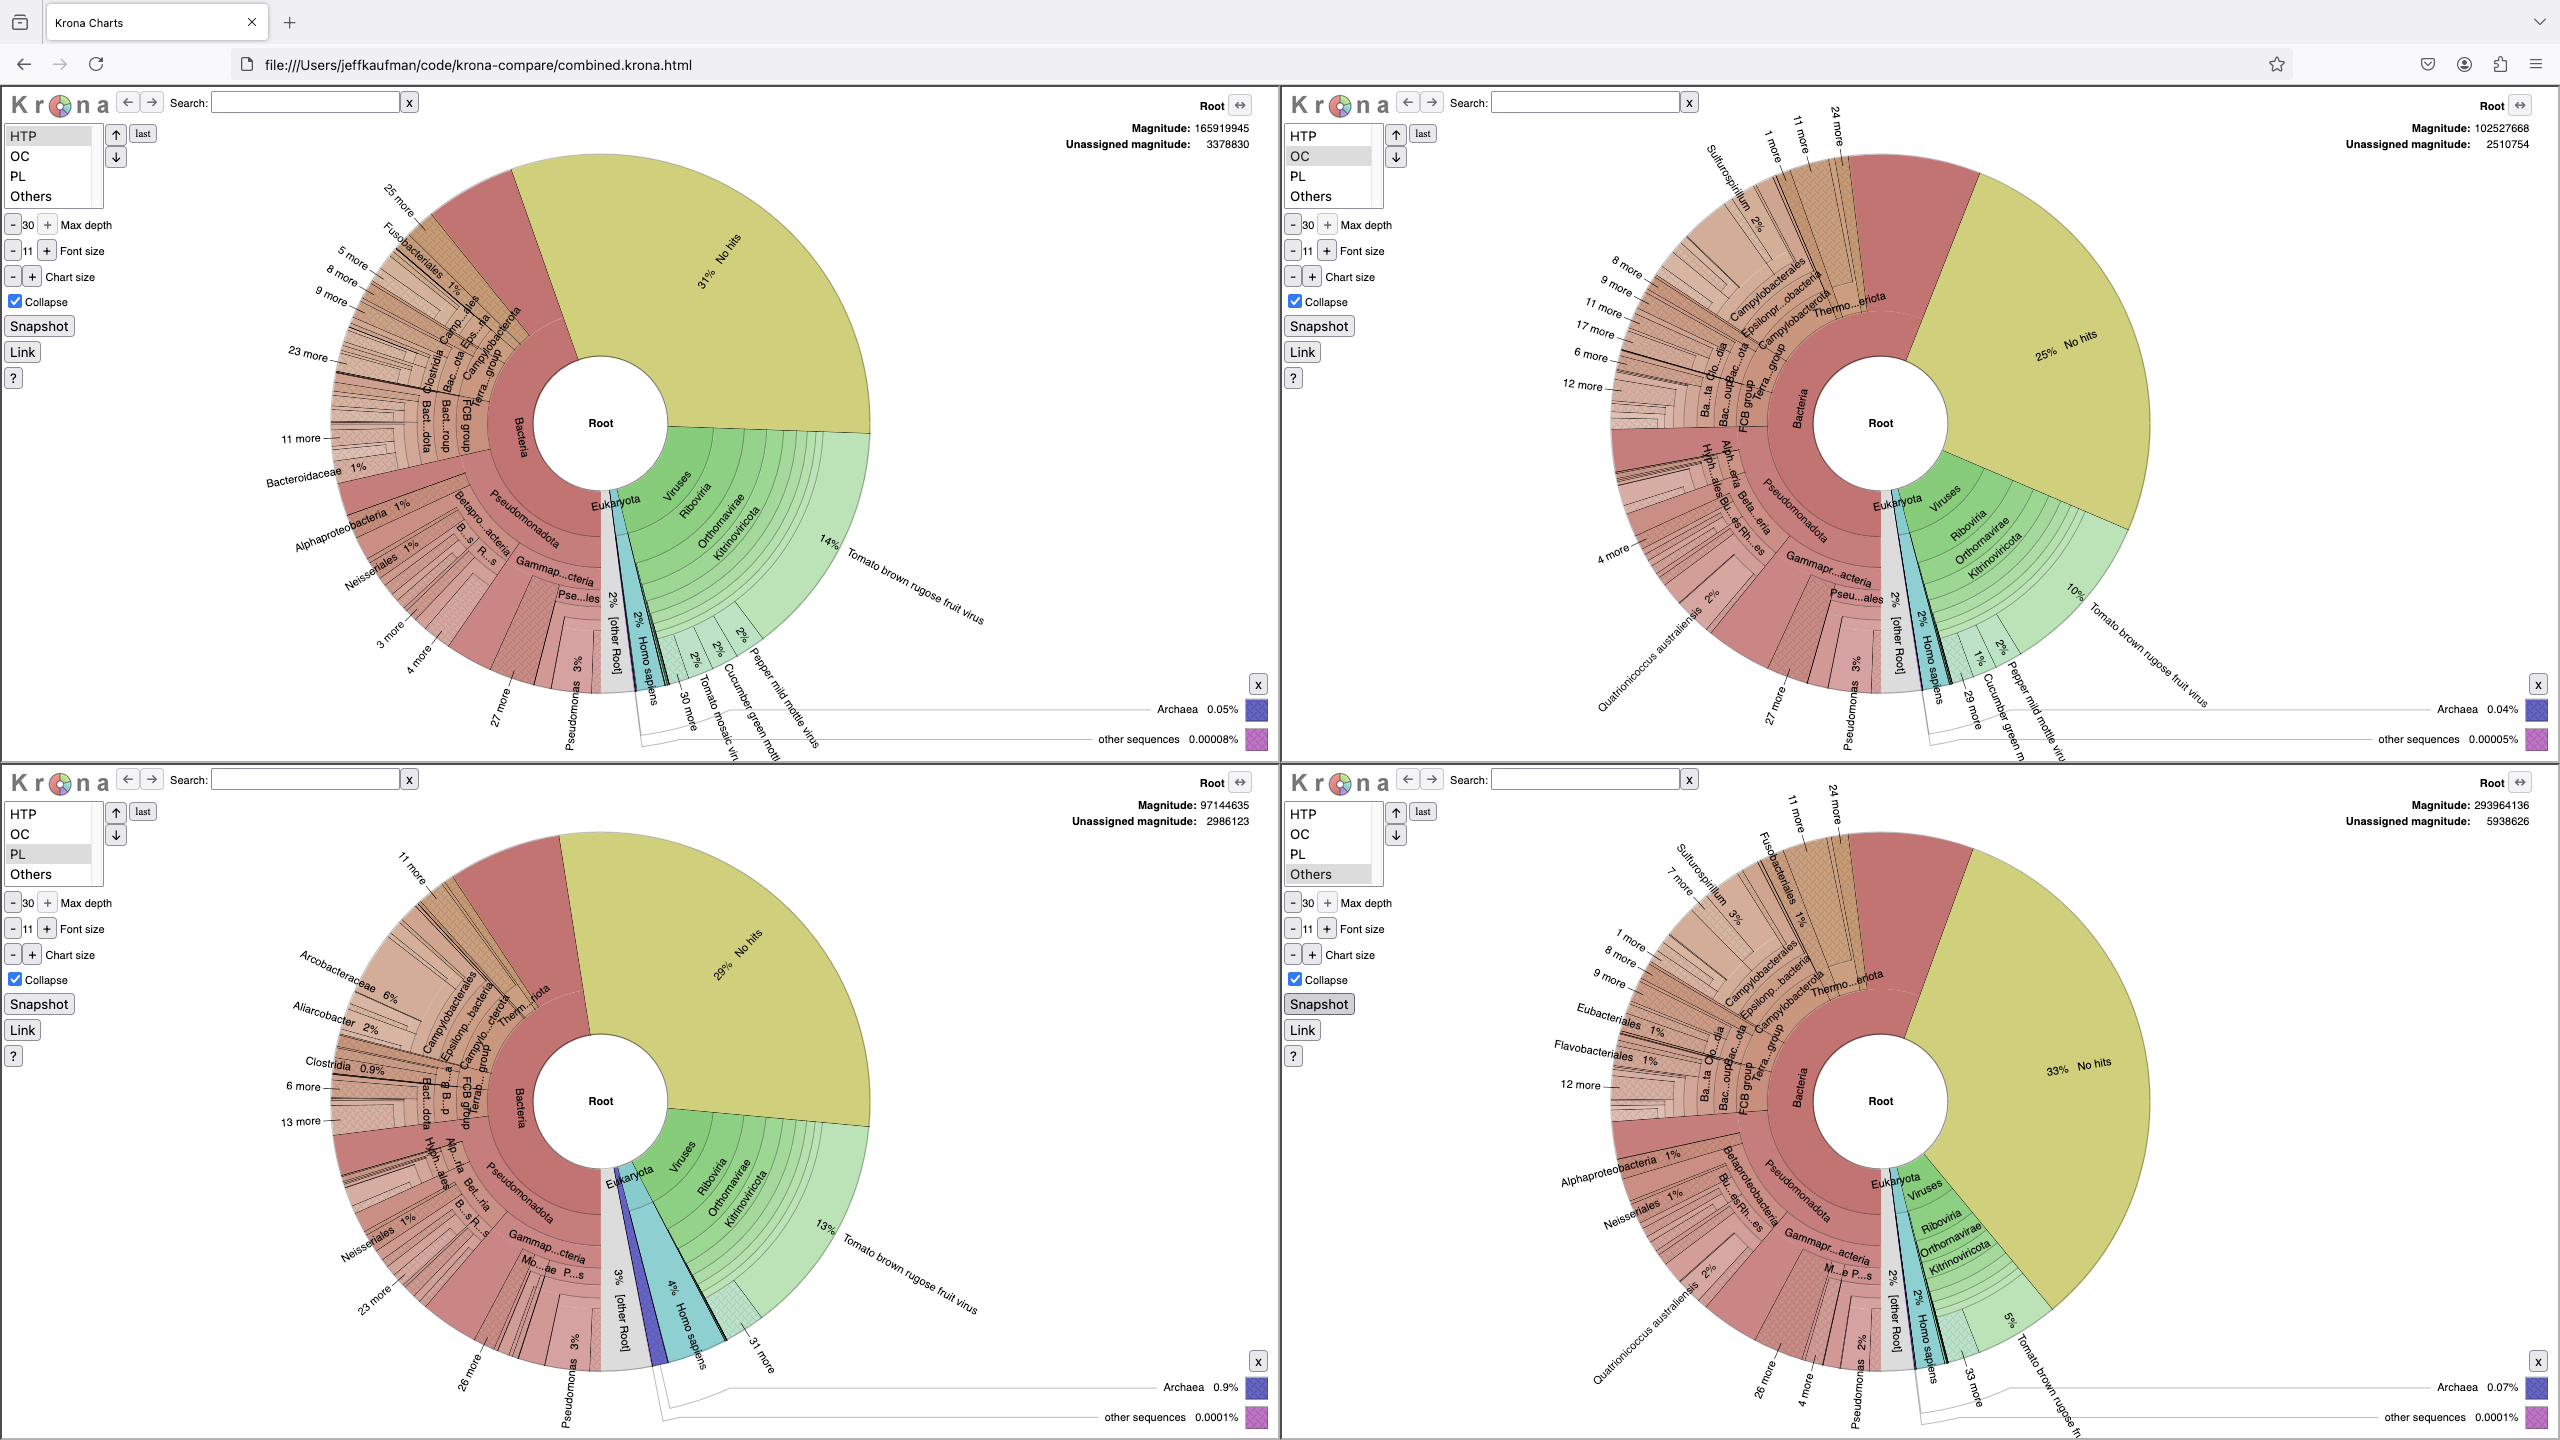
Compare samples with linked Krona charts. The charts are linked in that it shows multiple ones simultaneously, and navigating one chart navigates the others.
Input format is TSV:
<taxid> <n_direct_assignments>
Additional columns are ignored.
This is compatible with the "cladecounts" format produced by the NAO MGS Pipeline.
Install Krona Tools. When I did this on 2024-07-17 this looked like:
$ wget https://github.com/marbl/Krona/releases/download/v2.8.1/KronaTools-2.8.1.tar
$ tar -xvf KronaTools-2.8.1.tar
$ cd KronaTools-2.8.1
$ sudo ./install.pl
$ ./updateTaxonomy.sh
./krona-compare.py counts1.tsv counts2.tsv ...

./krona-compare.py --group <name1> counts1a.tsv counts1b.tsv ... \
                   --group <name2> counts2a.tsv counts2b.tsv ... \
                   ...
If you choose to group inputs, within each group list the counts will be combined and presented as a single chart with the provided name.
If you need a more complex grouping, consider writing a program to pre-group samples. For example, running something like this script which prepares the unnriched Rothman et al. 2021 data for the following command:
./krona-compare.py --group HTP HTP.tsv \
                   --group OC OC.tsv \
                   --group PL PL.tsv \
                   --group Others JWPCP.tsv NC.tsv SB.tsv SJ.tsv ESC.tsv
