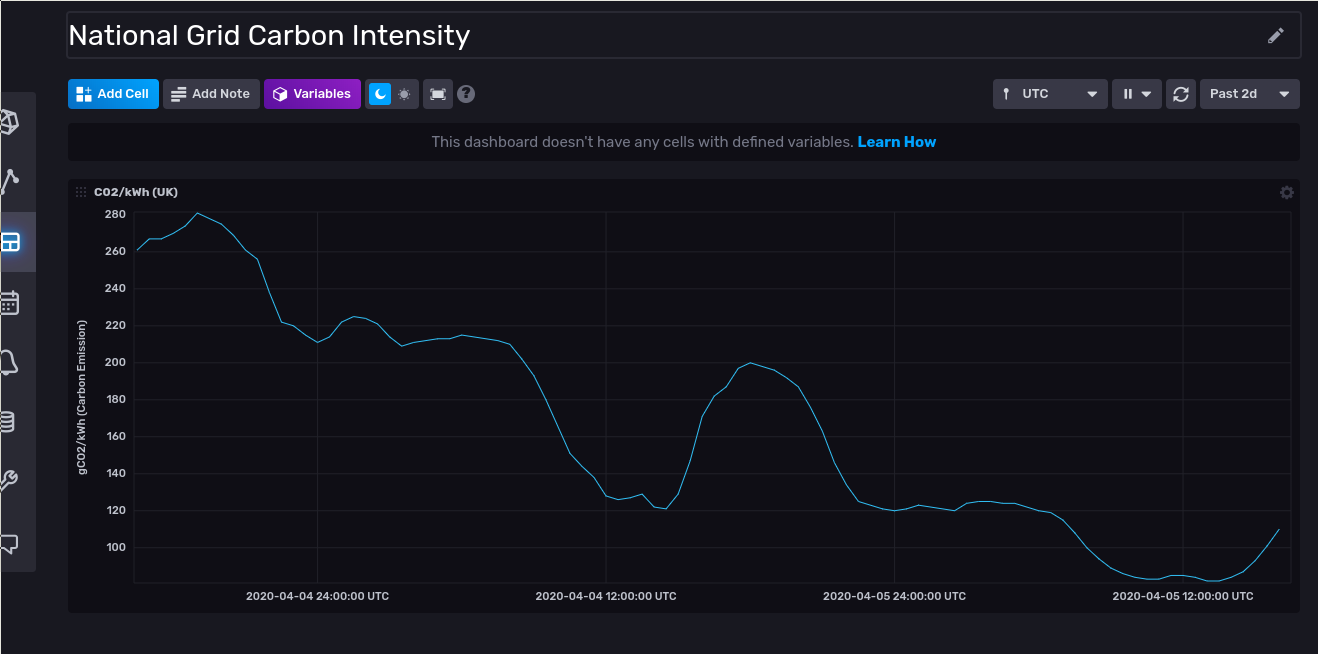
A Clojure application for polling https://carbon-intensity.github.io/api-definitions/#carbon-intensity-api-v2-0-0 periodically to capture carbon intensity, i.e. CO2 emissions in grams per kWh of energy generated in UK.
InfluxDB is used for storing the time series data. InfluxDB comes with a graphing dashboard that can display the information stored in InfluxDB. A rest API makes the data stored in InfluxDB available for updating (adding new time series data points) and querying.
Polling is resumed from the last stored timestamp to account for the application downtime. Carbon Intensity API is retried for queries with exponential backoff until the query succeeds.
The setup uses docker and docker-compose so they need to be
installed. After installation, ./start.sh script builds the
containers, setups up InfluxDB and starts the application.
InfluxDB can be accessed at http://localhost:9999 after the
application has completely started. The default username and password
are admin and password. These can be changed through environment
variables if made available to the starth.sh script.
Initialize and start the application:
$ ./start.sh
After the application starts, it will start populating past data from the API. The data can be viewed using InfluxDB's dashboard available at http://localhost:9999. Here is an example dashboard:
