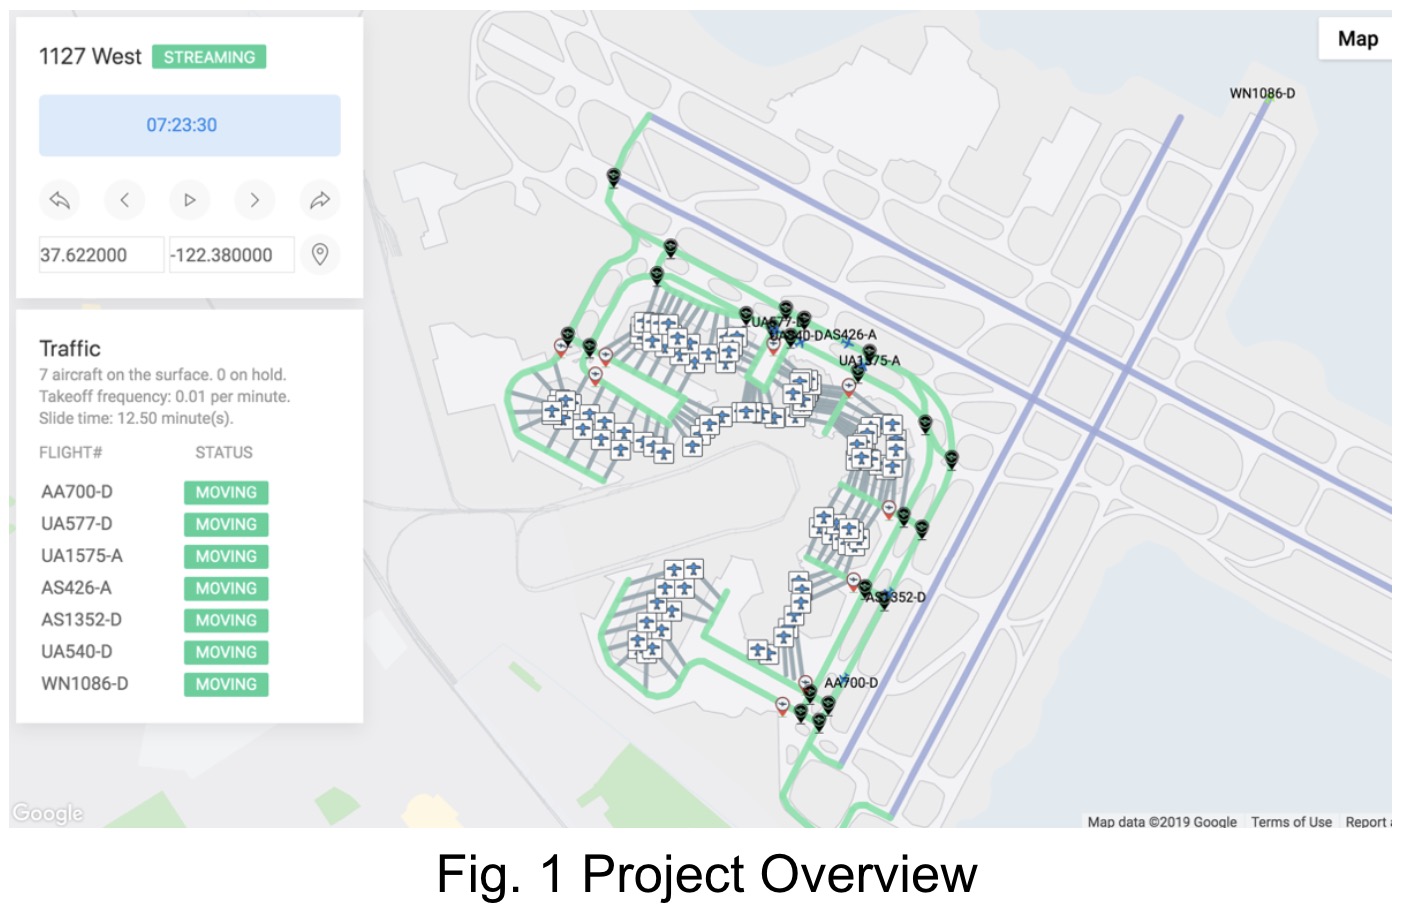
ASSET2 is a generic airport simulation tool for research purpose. It is designed to support multiple airports, to test and to evaluate customized schedulers. Please check out our paper for more information.
This tool is built for Carnegie Mellon University MSIT Practicum Project and Master Independent Study sponsored by the NASA Ames Research Center.
Please note that the code runs in Python 3.
Please avoid Python>=3.7.0 because it breaks the legacy Cython, which one of the dependencies line-profiler (test package) depends on. The issue has not been fixed at the moment. Try to install a lower version instead.
$ mkdir -p ~/.config/matplotlib/
$ echo "backend : Agg" >> ~/.config/matplotlib/matplotlibrc
$ conda create -n myenv python=3.6
$ conda activate myenv
$ pip install -r requirements.txt # install dependencies locally
$ cd data/real-west-all-terminals
$ python generate_scenario.py
$ python generate.py
$ cd ../../
$ python visualization/server.py
(or $pythonw visualization/server.py)Place airport related data (kml file) under data folder like data/sfo-terminal-2/build/ (use IATA airport code).
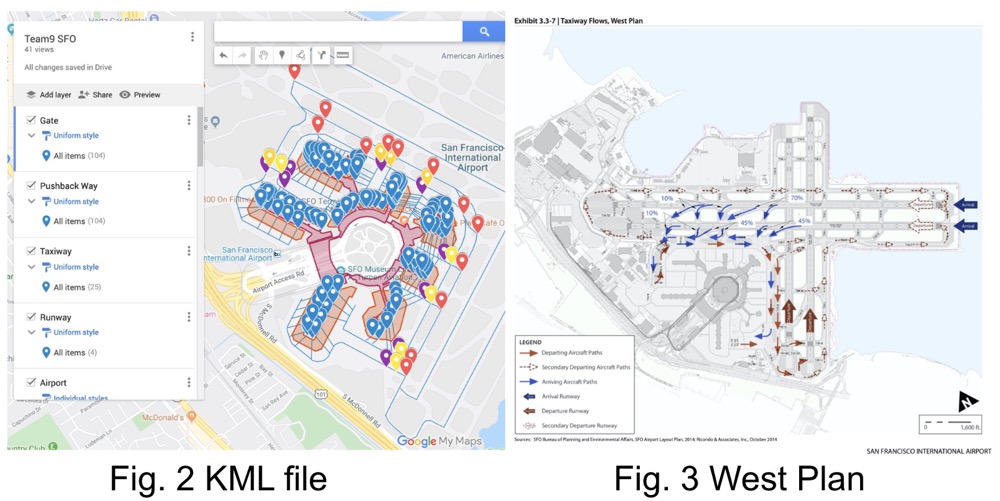
Now we build the whole sfo map on Google map: https://drive.google.com/open?id=1wUbdfLDRcGiitjo_h5ar-xlAO7OmdVOg&usp=sharing
If you need to change it, export one kml file and change codes at 'data/*/build/generate.py', especially 'class LayerType(Enum)'
We design taxiways in the map following west plan that let all departure airlines share same and fixed taxiways and all arrival airlines share the same and fixed taxiways. (shortest path algorithm)
We use the web crawler to get real sfo data from www.flysfo.com, please refer to data/sfo/crawl_scenario.py for more infomation.
'data//build/generate_scenario.py' and 'data//build/time_manage.py' are both used to handle real data.
- import the kml file to 'data/*/build/'
- create one ymal file for it under 'plans/*.yaml'
- run "python3.6 visualization/server.py"
- after opening the link, all yaml files under 'plans/' will be shown on the menu. You can choose one. Maybe it needs several minutes to show new data unless you already have cache.
python visualization/server.py
In the web page, select sfo-all-terminals as the data, and then you can see the simulation right away.
Besides that, you can also use batch mode according to the following.
$ python simulator.py -f plans/base.yaml
$ python simulator.py -f batch_plans/simple-uc.yaml # Batch Run
batch mode is used to run cached data. You may need it because our system will be slow after running two hours.
$ python visualization/server.py$ python -m unittest discover tests # all tests
$ python -m unittest tests/test_scheduler.py # single test$ pycodestyle --show-pep8 --show-source --exclude=venv .
$ ls -1 *py scheduler/*py | xargs pylint # optional but recommended$ pydoc <python-file-name-without-.py>$ python csvdata.py real-west-all-terminalsThe following steps are suggested for lauching an successful experiment systematically.
-
Compose and launch a single plan to find out (a) the upper bound of the value of the experimental variable and (b) the execution time for a single run.
$ time ./simulator.py -f plans/<upper-bound-to-try>.yaml -
Use the visualization tool on the single plans you launched in step one to see if things are working as expected. For example, you should check if the aircrafts are busy enough in order to retrieve a meaningful plot.
$ ./visualiztion/server.py -
By using the execution time and upper bound information we collected from the previous steps we can then lanuch a batch run with
try_until_success: False. The execution time of this batch run should be able to estimated. -
By using the execution time and failure rate information from the previous steps, we can then launch a batch run with
try_until_success: Trueto obtain meaningful final results.
Please ALWAYS follow PEP 8 -- Style Guide for Python Code for readability and consistency.
Default logging level is set in simulation.py, and please initialize logging
for each class in __init__ like this way:
self.logger = logging.getLogger(__name__)
Put breakpoint in this way:
import pdb; pdb.set_trace()
Also, please refer to our Google Map for debugging the details.
For consistency, following units are used everywhere in the code:
Time: second
Length: ft
Routing table calculated by the routing expert will be cached at cache/ so
please make sure all the objects in routing table can be dumped into binary
file using pickle. Ex. logger can't be dumped.
Note that cache may cause errors or bugs in many cases because stale data is used.
Simulation time (sim_time) indicates the time should be passed in each
tick() and it can be accessed globally in any place by using following
syntax:
from clock import Clock
self.logger.debug("sim time is %s", Clock.sim_time)
To speedup the simulation, we can apply some profiling technique to locate the
slow code. Add @profile decorator at the beginning of the function you want to
profile, then do following commands to obtain a report of the execution time of
each line within the function.
$ kernprof -l ./simulator -f <your_plan>.yaml
$ python3 -m line_profiler simulator.py.lprof
Right now, we have two types of airport surface models: node-link model and graph model. The graph model (in graph_model.py) is newly added and can be used by scheduler and controller. However, right now, this script generates an arrival and a departure model for one airport. Need to find a way to merge these two information so that scheduler can use to manage aircrafts' movements.


