1. Add the following records to your host file:
127.0.0.1 identity
127.0.0.1 be-java-tracing-demo
127.0.0.1 otel-collector
127.0.0.1 grafana
127.0.0.1 tempo
2. Start docker compose
Go to folder Secure-FE-Tracing-Opentelemetry run docker compose up .The command will start following containers
- Keycloak http://identity/ with Import Realm data
Console Admin: admin / admin
Realm: opentelemetry
Client: fe-demo
User: test / password
- Nginx exposes otel-collector, keycloak and backend URL
server {
  server_name identity;
  location / {
	proxy_pass http://identity:8080;
  }
}
server {
  server_name otel-collector;
  location / {
	proxy_pass http://otel-collector:4318;
  }
}
server {
  server_name be-java-tracing-demo;
  location / {
	proxy_pass http://be-java-tracing-demo:8000;
  }
}
- Opentelemetry Collector has an OpenID Connect extension (uses Keycloak as OAuth Server) to verify token received from http
extensions:
  oidc:
    issuer_url: http://identity:8080/realms/opentelemetry
    audience: account
    attribute: Authorization

receivers:
  otlp:
    protocols:
      grpc:
      http:
        auth:
          authenticator: oidc
BE sends traces via port gRPC 4317 without Authorization.
FE send traces via port http 4318 with Authorization Bearer Token.
http://otel-collector:4318 is exposed as http://otel-collector by Nginx. You can test Authorization by calling endpoint in Postman with No Auth. it responses 401 Unauthorized

- BE java (be-java-tracing-demo) to demo tracing API
- Grafana http://grafana:4000/
- Grafana Tempo
- Postgresql
- Start FE Reactjs
- Open
fe-reactjs-tracing-demousing Visual Studio Code (or any tool you are familiar with) - Install
npm i -f - Start application
npm start - Verify FE by access http://localhost:3000

- Test tracing application
-
click Login button then login with user
test/password -
After logged in, the Trace button will appear
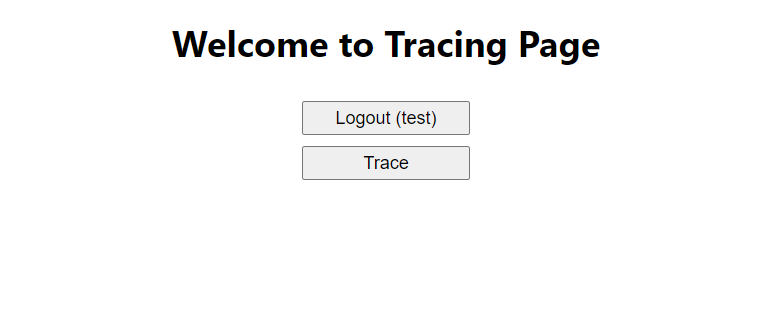
-
Click Trace button then check Network tab. You will see that besides calling the BE
/api/outgoing-http-call, FE also sends trace requests to the opentelemetry collector via the URL http://otel-collector/v1/traces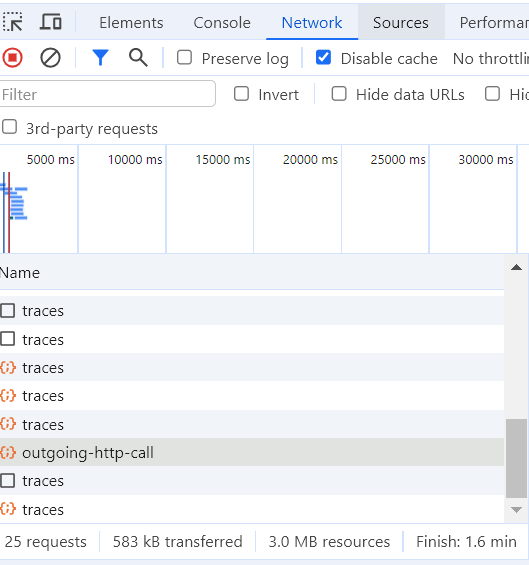
-
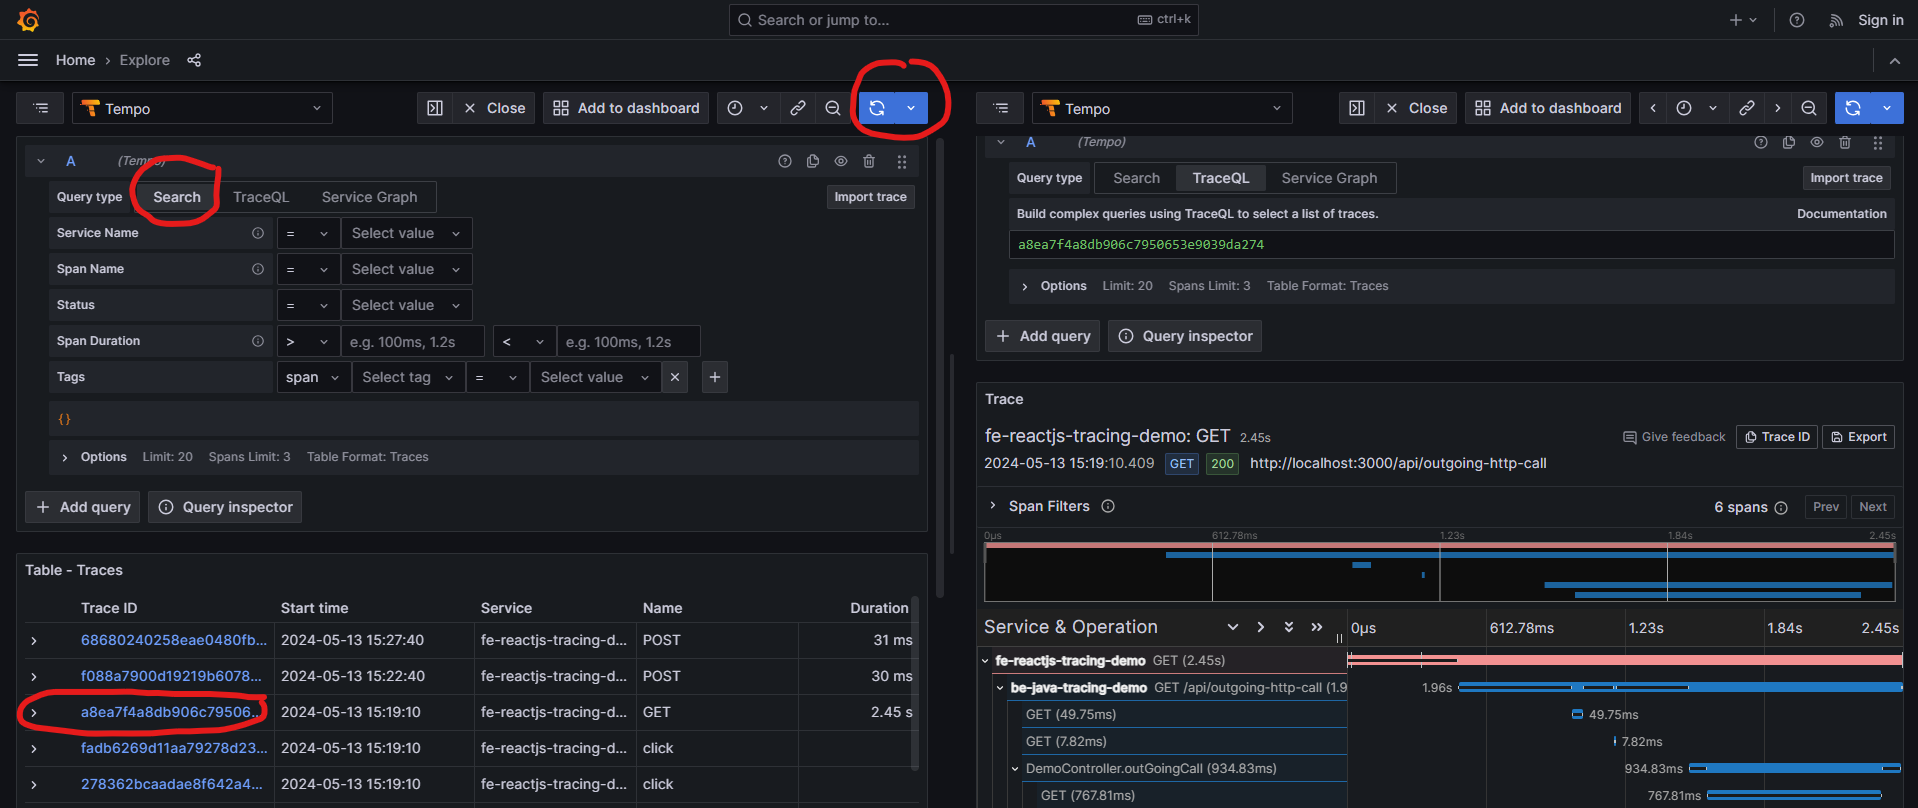
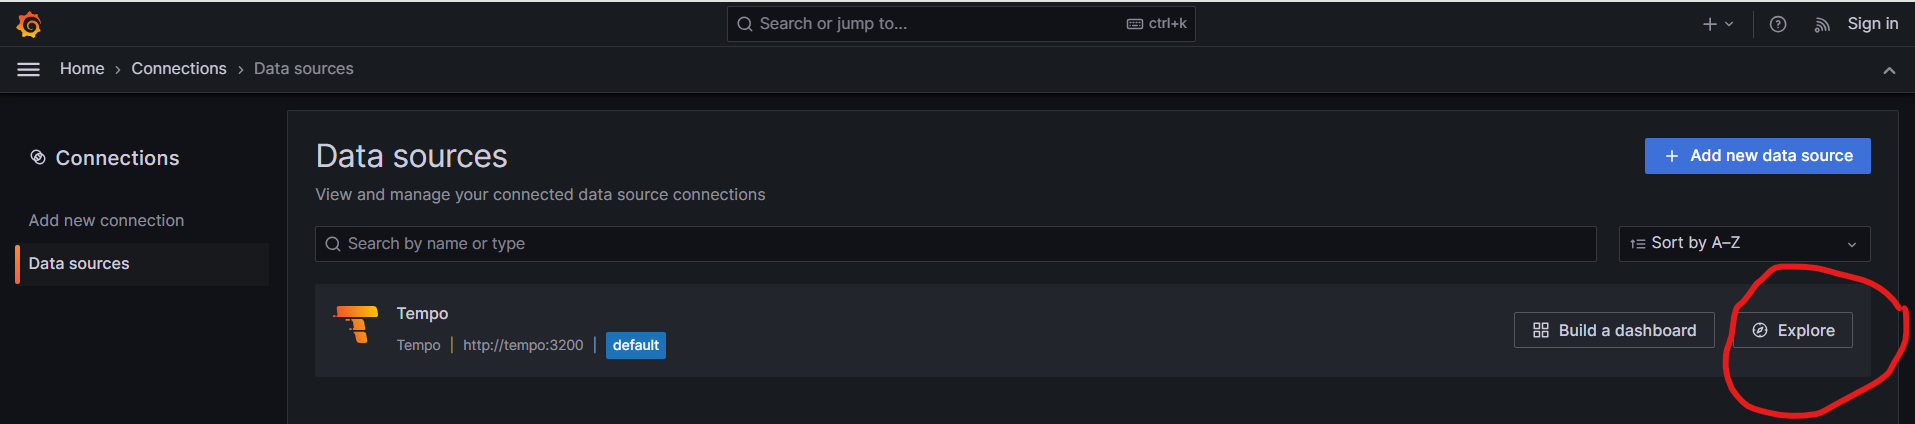
Access Grafana http://grafana:4000/ . Home -> Connections -> Data Sources -> Tempo -> Explore
-
Choose Search -> Run Query -> Choose traceId, you will see a full trace from FE to BE