Save everything you need to compare and reproduce models — architecture, hyperparameters, weights, model predictions, GPU usage, git commits, and even datasets — in 5 minutes. W&B is free for personal use and academic projects, and it's easy to get started.
→ Check out our library of example scripts → or read on for code snippets and more!
Install wandb library and login:
pip install wandb
wandb login
Flexible integration for any Python script:
import wandb

# 1. Start a W&B run
wandb.init(project='gpt3')

# 2. Save model inputs and hyperparameters
config = wandb.config
config.learning_rate = 0.01

# Model training code here ...

# 3. Log metrics over time to visualize performance
for i in range (10):
wandb.log({"loss": loss})If you have any questions, please don't hesitate to ask in our Slack community.
Set wandb.config once at the beginning of your script to save your hyperparameters, input settings (like dataset name or model type), and any other independent variables for your experiments. This is useful for analyzing your experiments and reproducing your work in the future. Setting configs also allows you to visualize the relationships between features of your model architecture or data pipeline and the model performance (as seen in the screenshot above).
wandb.init()
wandb.config.epochs = 4
wandb.config.batch_size = 32
wandb.config.learning_rate = 0.001
wandb.config.architecture = "resnet"In Keras, you can use our callback to automatically save all the metrics tracked in model.fit. To get you started here's a minimal example:
# Import W&B
import wandb
from wandb.keras import WandbCallback

# Step1: Initialize W&B run
wandb.init(project='project_name')

# 2. Save model inputs and hyperparameters
config = wandb.config
config.learning_rate = 0.01

# Model training code here ...

# Step 3: Add WandbCallback
model.fit(X_train, y_train,  validation_data=(X_test, y_test),
callbacks=[WandbCallback()])W&B provides first class support for PyTorch. To automatically log gradients and store the network topology, you can call .watch and pass in your PyTorch model.
Then use .log for anything else you want to track, like so:
import wandb

# 1. Start a new run
wandb.init(project="gpt-3")

# 2. Save model inputs and hyperparameters
config = wandb.config
config.dropout = 0.01

# 3. Log gradients and model parameters
wandb.watch(model)
for batch_idx, (data, target) in enumerate(train_loader):
  ...
  if batch_idx % args.log_interval == 0:
    # 4. Log metrics to visualize performance
wandb.log({"loss": loss})The simplest way to log metrics in TensorFlow is by logging tf.summary with our TensorFlow logger:
import wandb

# 1. Start a W&B run
wandb.init(project='gpt3')

# 2. Save model inputs and hyperparameters
config = wandb.config
config.learning_rate = 0.01

# Model training here

# 3. Log metrics over time to visualize performance
with tf.Session() as sess:
  # ...
wandb.tensorflow.log(tf.summary.merge_all())Visualize, compare, and iterate on fastai models using Weights & Biases with the WandbCallback.
import wandb
from fastai2.callback.wandb import WandbCallback

# 1. Start a new run
wandb.init(project="gpt-3")

# 2. Automatically log model metrics
learn.fit(..., cbs=WandbCallback())Just run a script using HuggingFace's Trainer in an environment where wandb is installed
and we'll automatically log losses, evaluation metrics, model topology and gradients:
# 1. Install the wandb library
pip install wandb

# 2. Run a script that has the Trainer to automatically logs metrics, model topology and gradients
python run_glue.py \
 --model_name_or_path bert-base-uncased \
 --task_name MRPC \
 --data_dir $GLUE_DIR/$TASK_NAME \
 --do_train \
 --evaluate_during_training \
 --max_seq_length 128 \
 --per_gpu_train_batch_size 32 \
 --learning_rate 2e-5 \
 --num_train_epochs 3 \
 --output_dir /tmp/$TASK_NAME/ \
 --overwrite_output_dir \
--logging_steps 50Use Weights & Biases Sweeps to automate hyperparameter optimization and explore the space of possible models.
- Quick to setup: With just a few lines of code you can run W&B sweeps.
- Transparent: We cite all the algorithms we're using, and our code is open source.
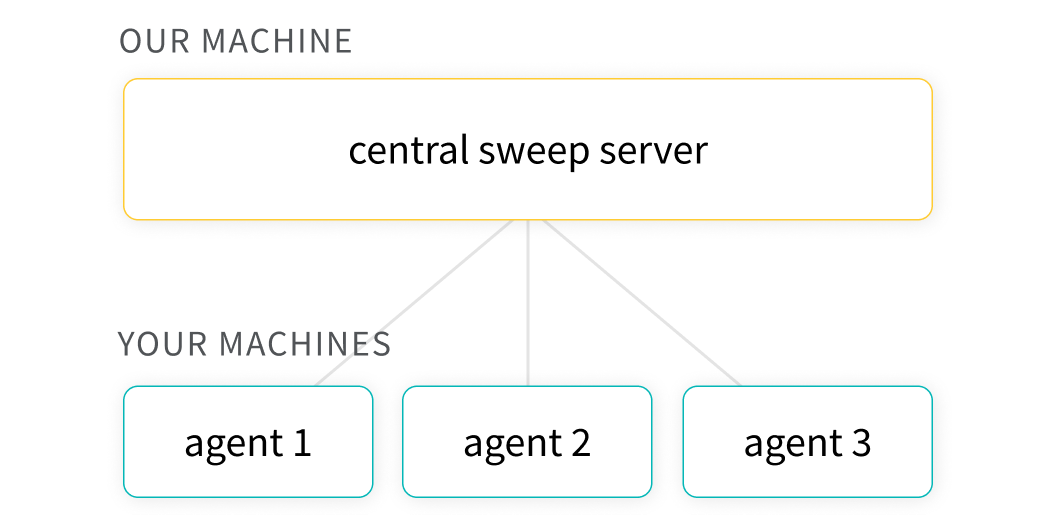
- Powerful: Our sweeps are completely customizable and configurable. You can launch a sweep across dozens of machines, and it's just as easy as starting a sweep on your laptop.
- Explore: Efficiently sample the space of hyperparameter combinations to discover promising regions and build an intuition about your model.
- Optimize: Use sweeps to find a set of hyperparameters with optimal performance.
- K-fold cross validation: Here's a brief code example of k-fold cross validation with W&B Sweeps.
The hyperparameter importance plot surfaces which hyperparameters were the best predictors of, and highly correlated to desirable values for your metrics.
Parallel coordinates plots map hyperparameter values to model metrics. They're useful for honing in on combinations of hyperparameters that led to the best model performance.
Reports let you organize visualizations, describe your findings, and share updates with collaborators.
- Notes: Add a graph with a quick note to yourself.
- Collaboration: Share findings with your colleagues.
- Work log: Track what you've tried and plan next steps.
Explore reports in The Gallery → | Docs
Once you have experiments in W&B, you can visualize and document results in Reports with just a few clicks. Here's a quick demo video.
If you have any questions, please don't hesitate to ask in our Slack community.


