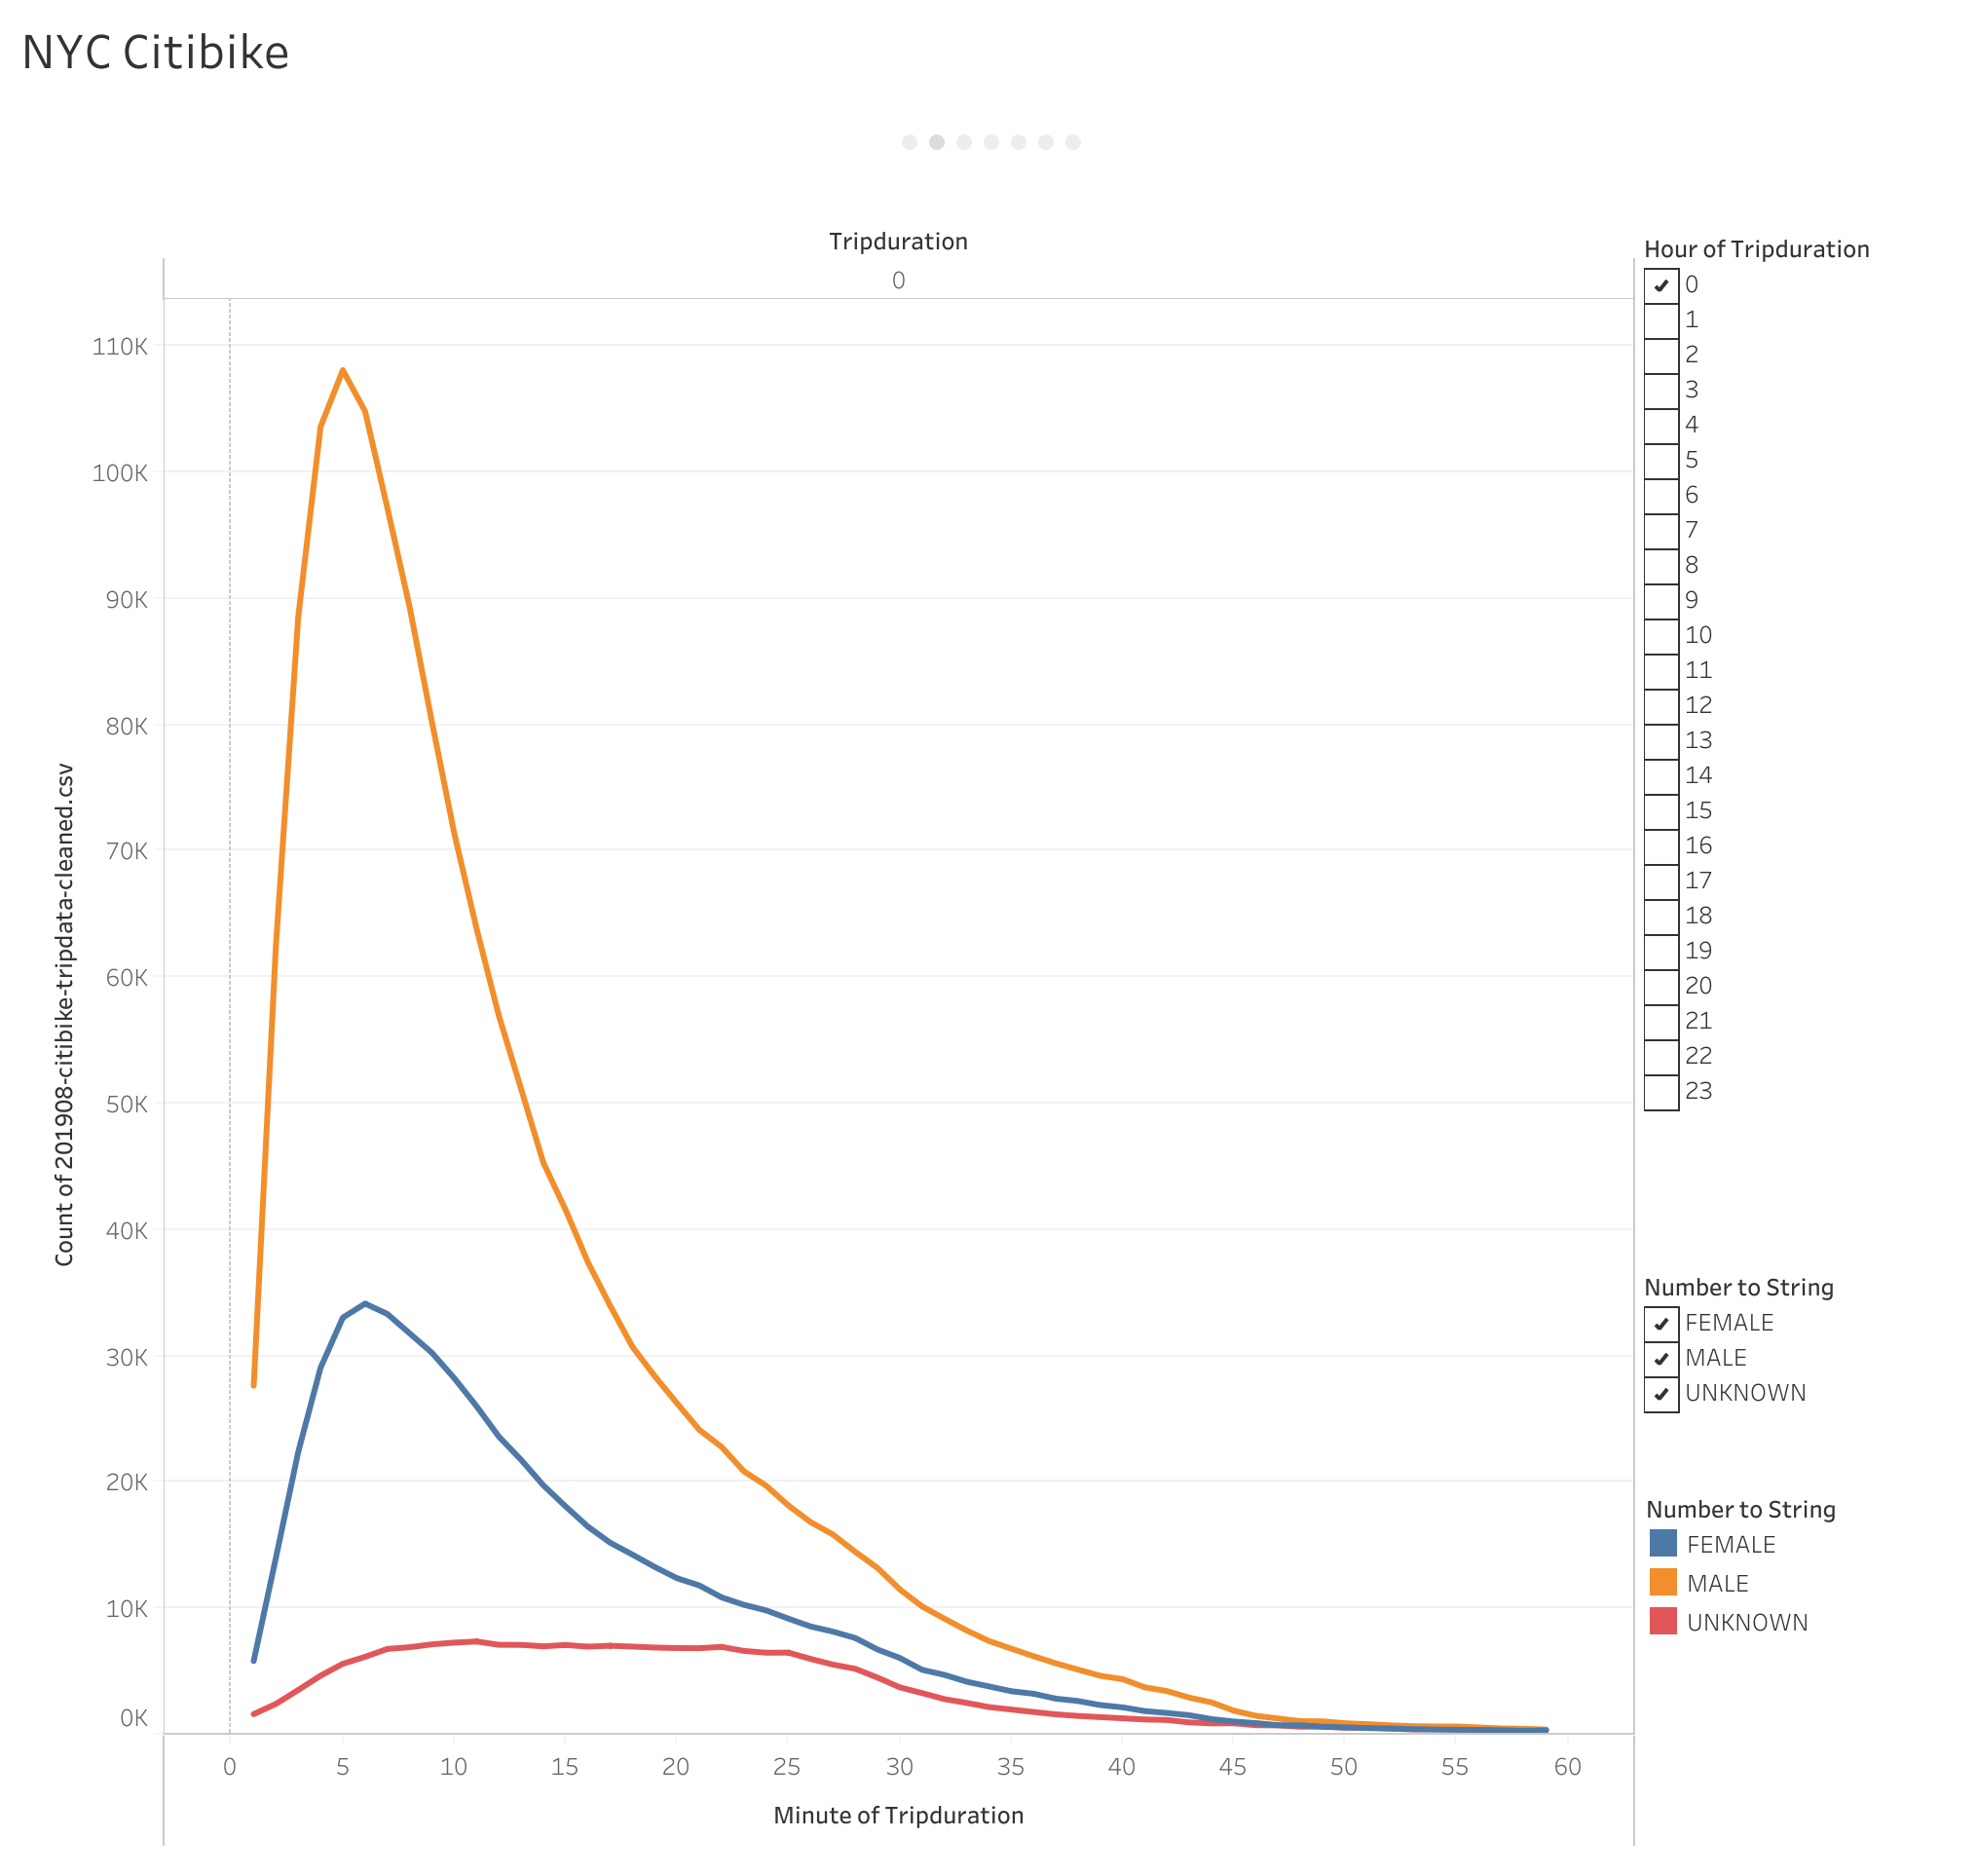
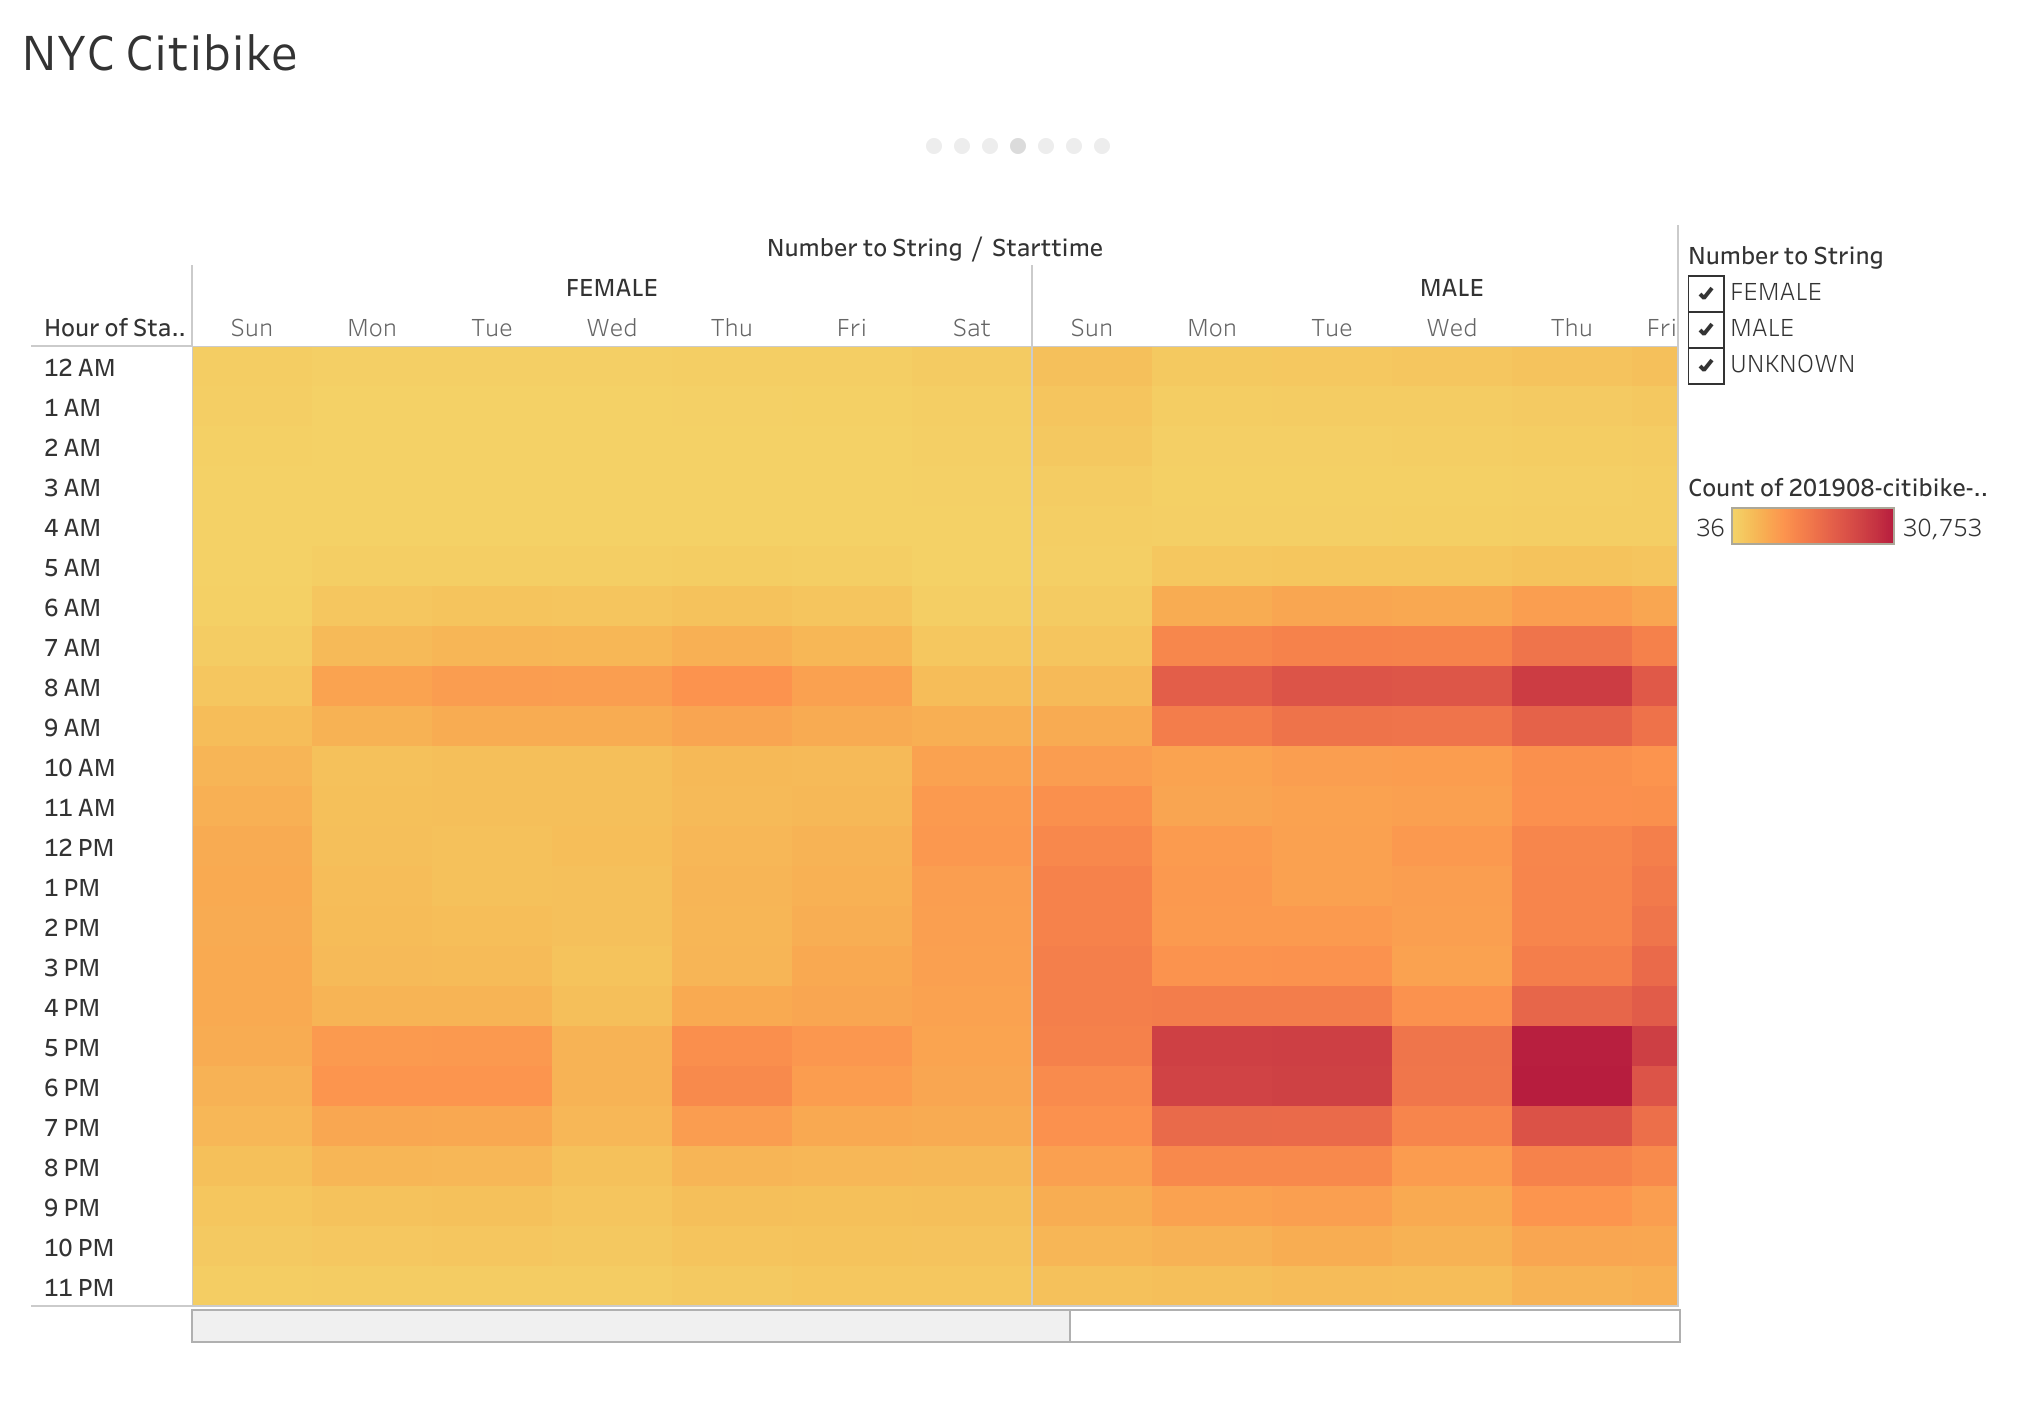
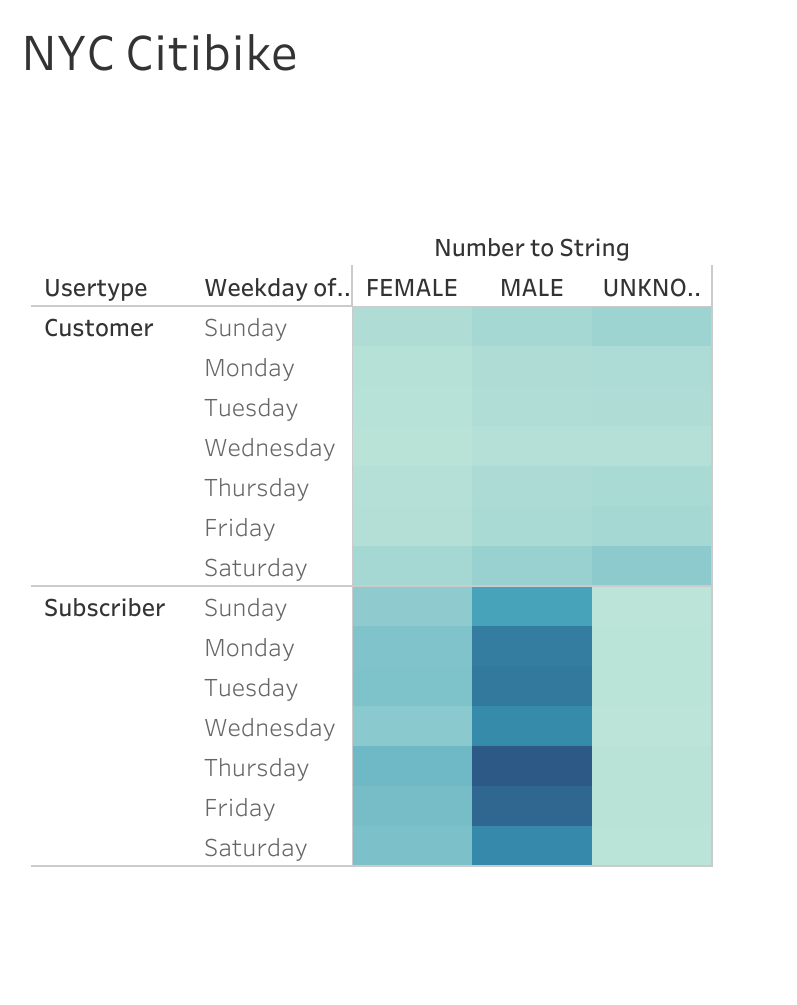
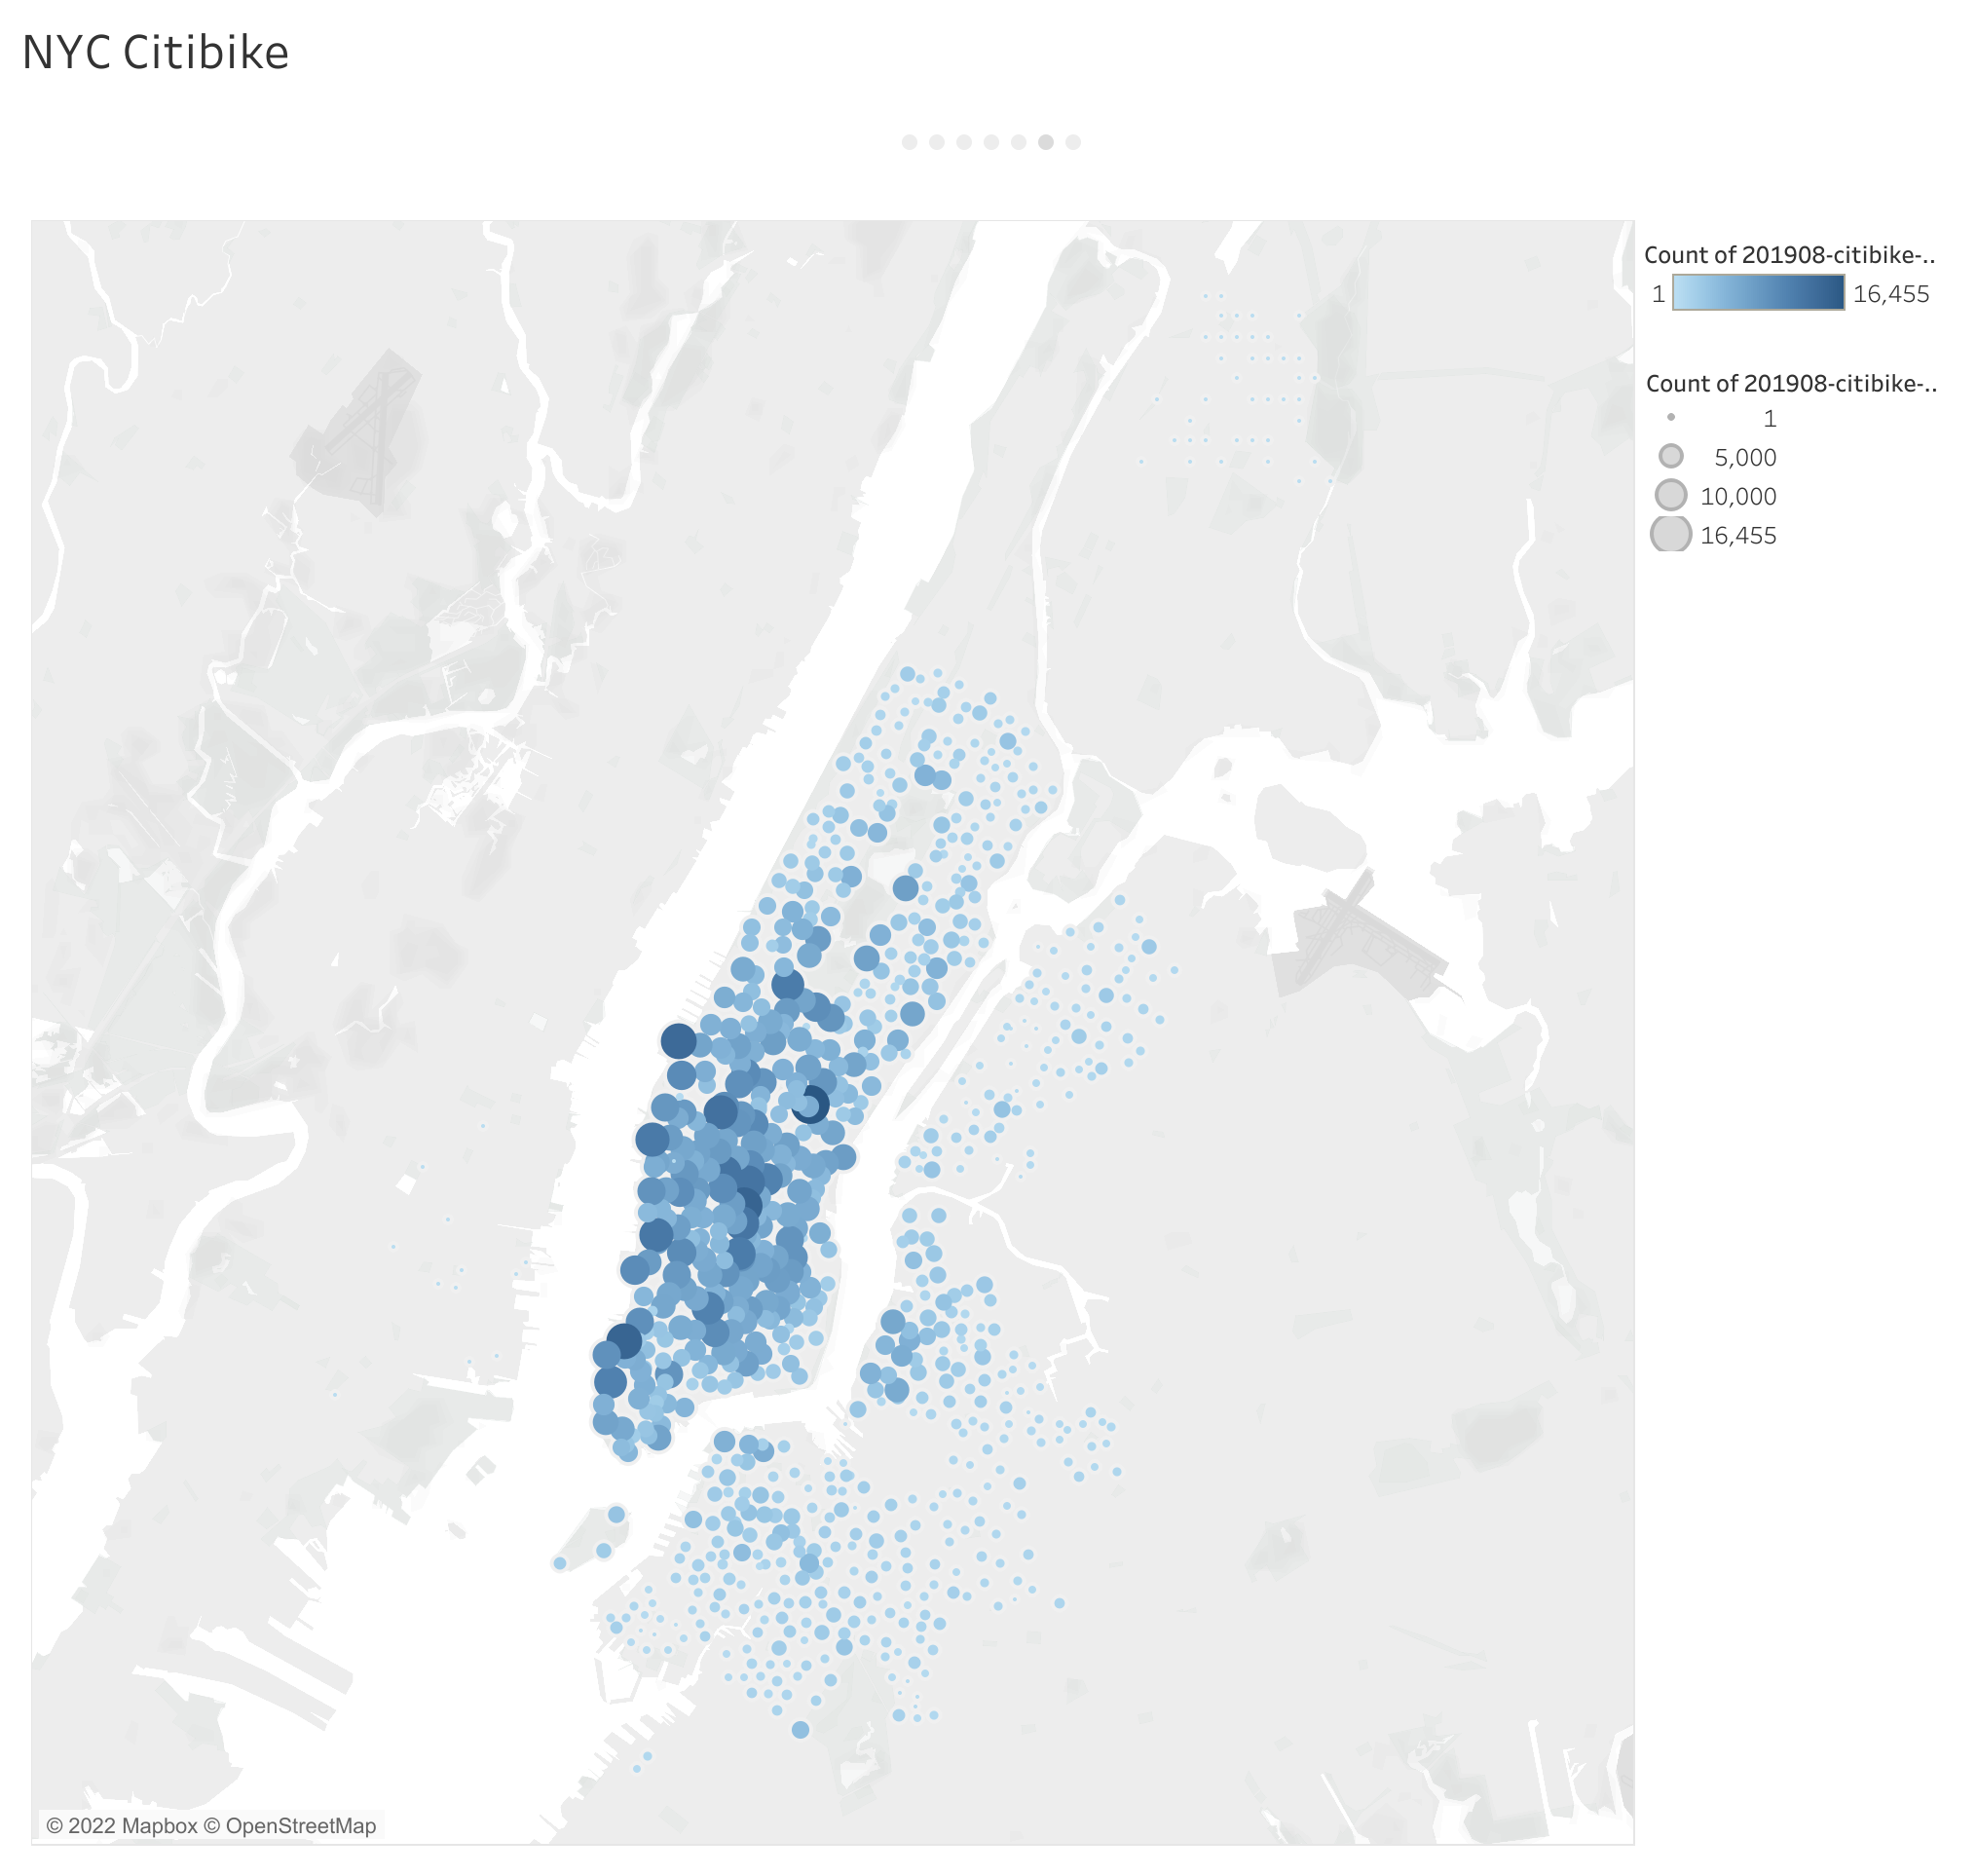
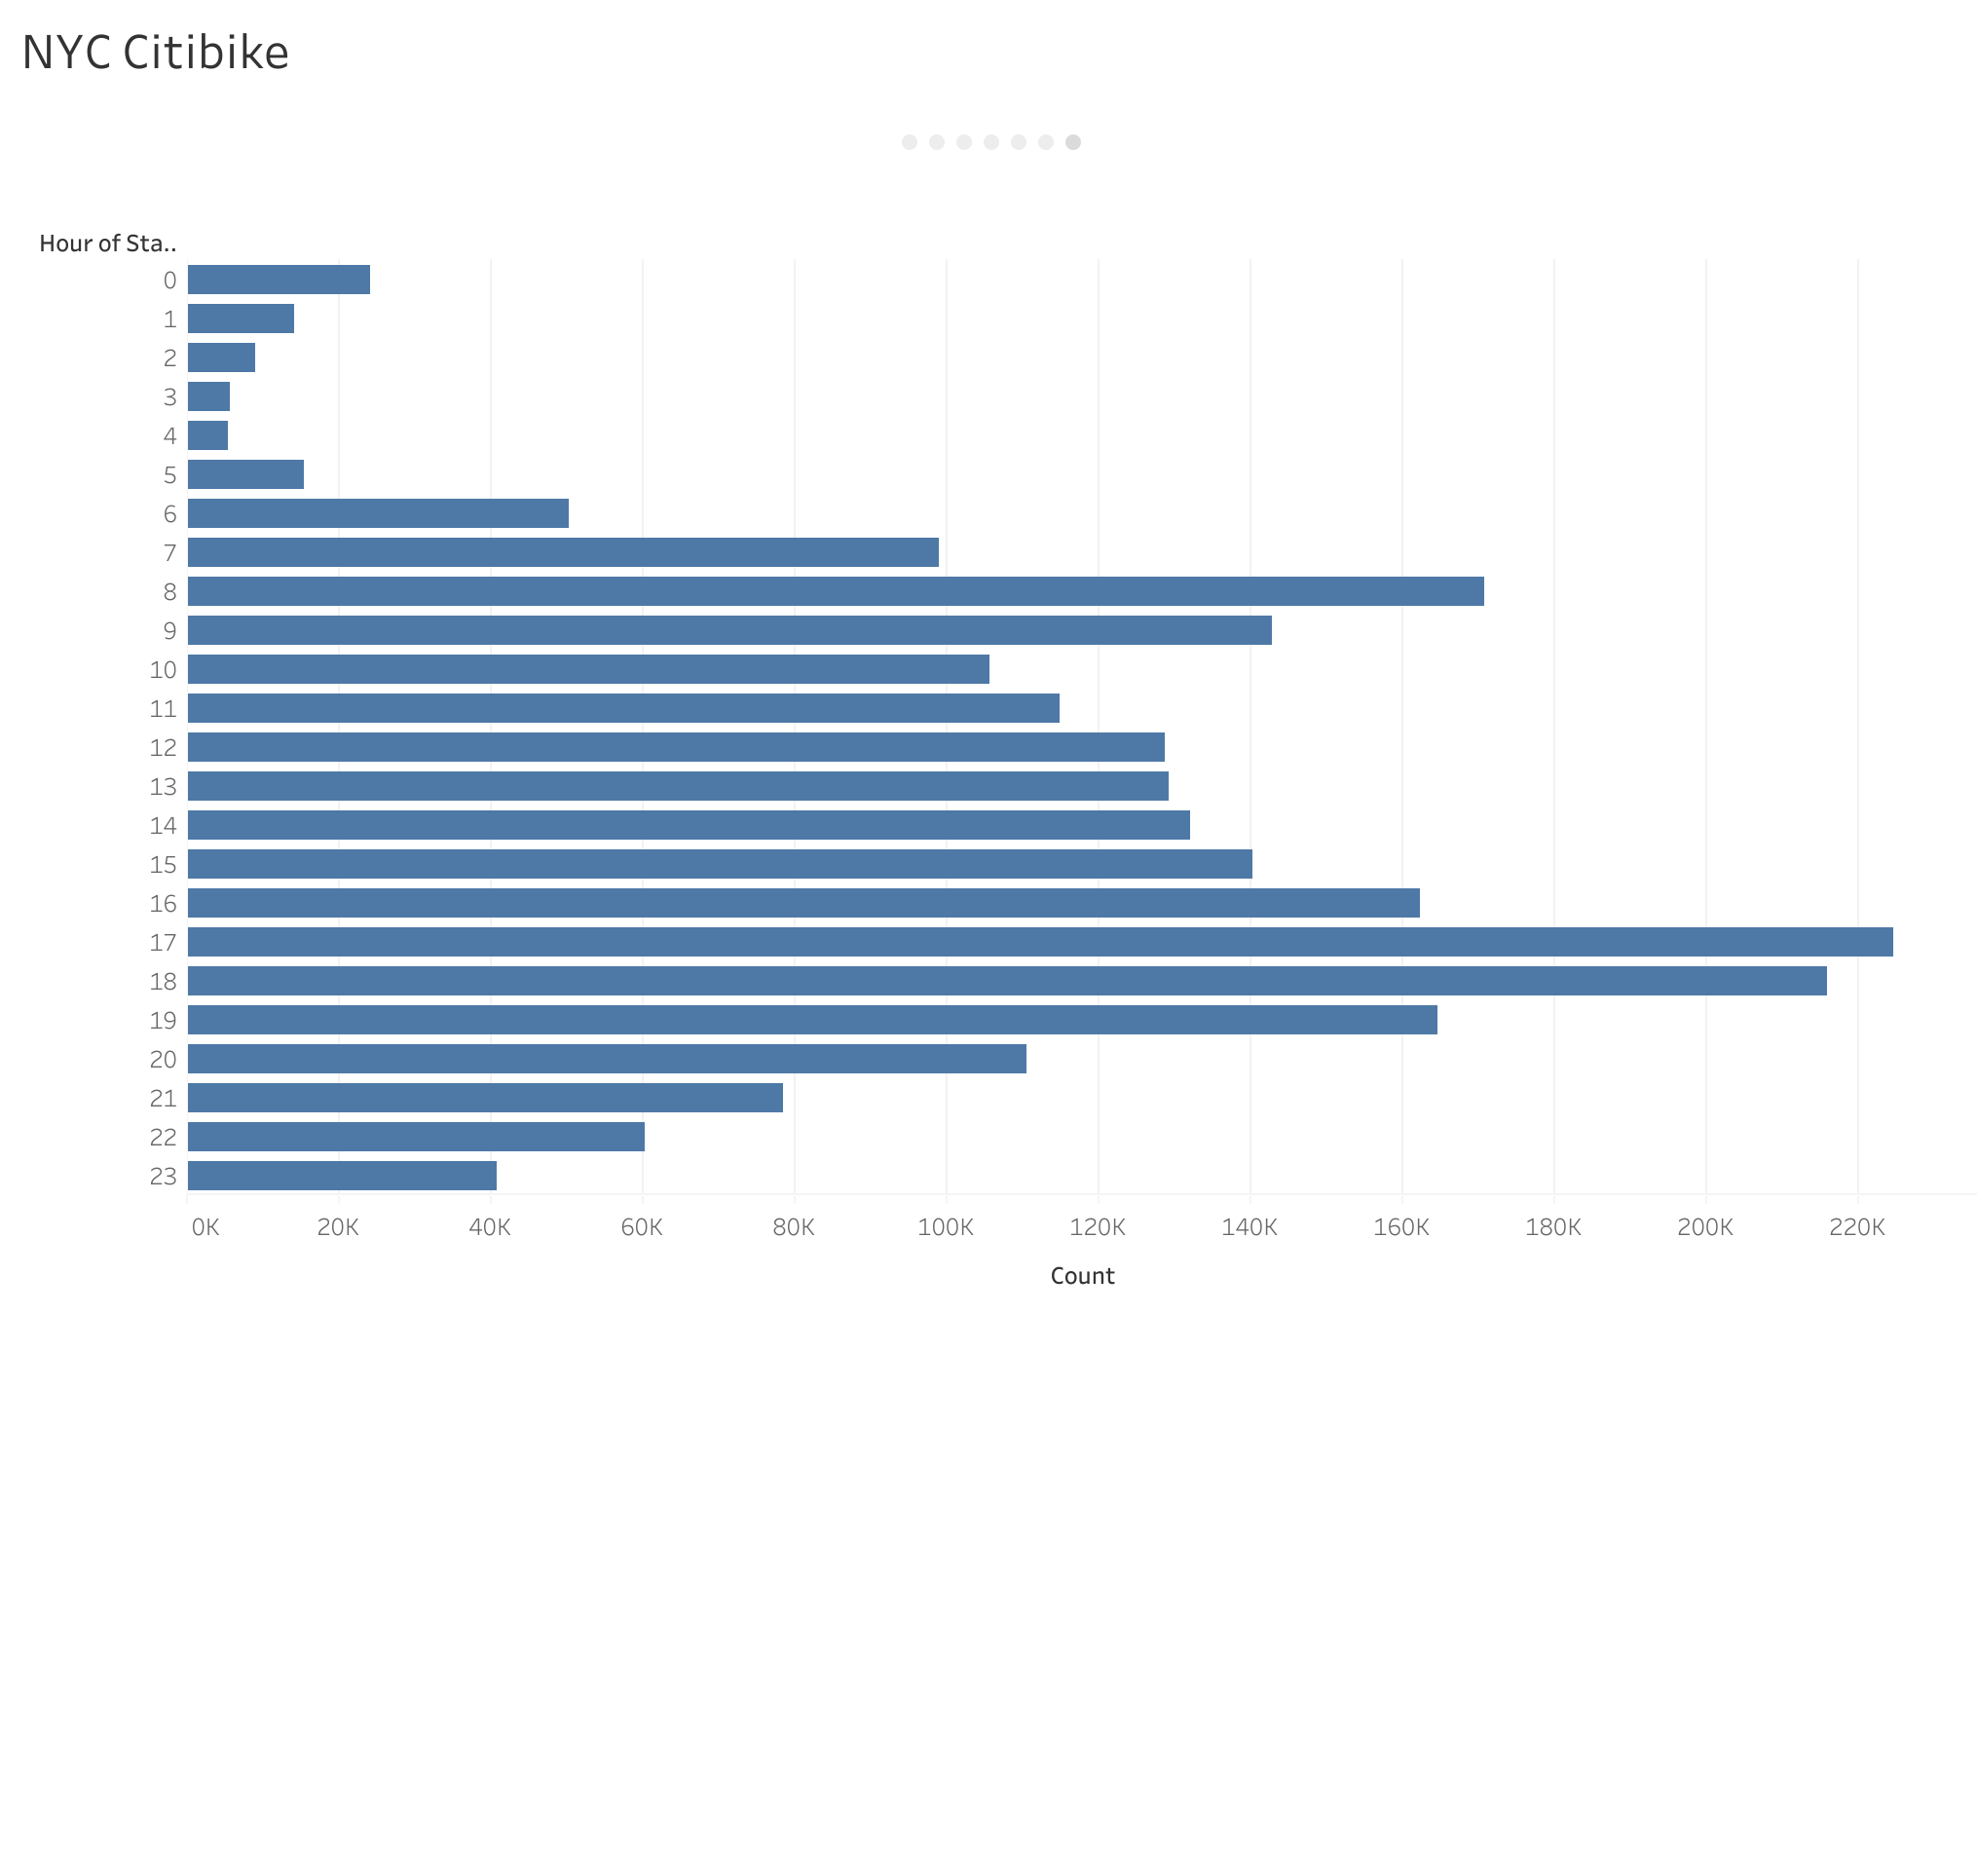
The purpose of this analysis is to construct a business proposal for Kate's bike-sharing company in Des Monies. We will be working with data from the Citi Bike program in New York City to help predict if Kate's desired location could produce a successful business. Kate suggests working within the data visualization software called Tableau. It's primary purpose is to deliver insights beyond those captured by spreadsheets. Tableau is undoubtedly the leader in the data viz space.
Before beginning our analysis, we must first clean our dataset. The tripduration column is initially stored with the int64 dtype. We will use Pandas to transform the tripduration variable into a datetime datatype.
| Original | Cleaned |
|---|---|
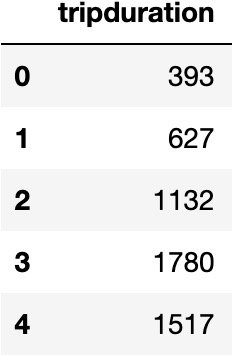 |
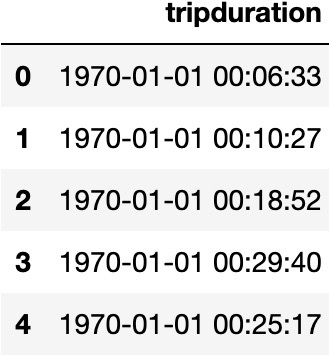 |
We next want to generate some questions that should inspire a set of visualizations.
