Updated: 14 July 2020
Authors: Marc Bevand, Michael A. Alcorn
The Florida Department of Health (FDOH) has an amazing dataset here: complete line list of the state's COVID-19 cases and deaths. To our knowledge, it is the only open dataset documenting the exact age of hundreds of thousands of cases. This gives us great insights because age is a very important factor affecting the Case Fatality Ratio (CFR) of COVID-19. This repository provides tools to analyze the data:
forecast_deaths.pyforecasts deaths in the state, based on various age-stratified CFR estimatesage_stratified_cfr.pycalculates the age-stratified CFR, based on recent deaths in the stategamma.pycalculates the times between onset of symptoms and death (onset-to-death) and fits them in a Gamma distributionheatmap.pycreates a heatmap representing the number of cases by age bracket evolving over time
To download the FDOH line list, browse the data page and click
Download → Spreadsheet. We made daily archives of the line list in directory
data_fdoh.
The line list is in CSV format and the columns are self-explanatory: Age,
Gender, County, boolean Died, etc. The columns are documented on page 12 of this
FDOH document. Two important columns:
ChartDate is the date used to create the bar chart in the FDOH dashboard.
EventDate is the date when symptoms started, or if that date is unknown, the
date lab results were reported to the FDOH. One of our sources claim more
precisely this date is the earlier of onset date, diagnosis date, or test date.
Our scripts trust the FDOH and assume EventDate is generally the onset date,
but we are aware this column may have data quality issues.
forecast_deaths.py does not rely on death data, but relies solely on case
ages, date of onset of symptoms, and various estimates of the age-stratified CFR.
The script starts by opening the latest line list CSV file (in directory data_fdoh)
or if no such file exists it downloads it from the FDOH line list page.
This gives us (1) the age of every case diagnosed with COVID-19, and (2) the
date of onset of symptoms (EventDate CSV column.)
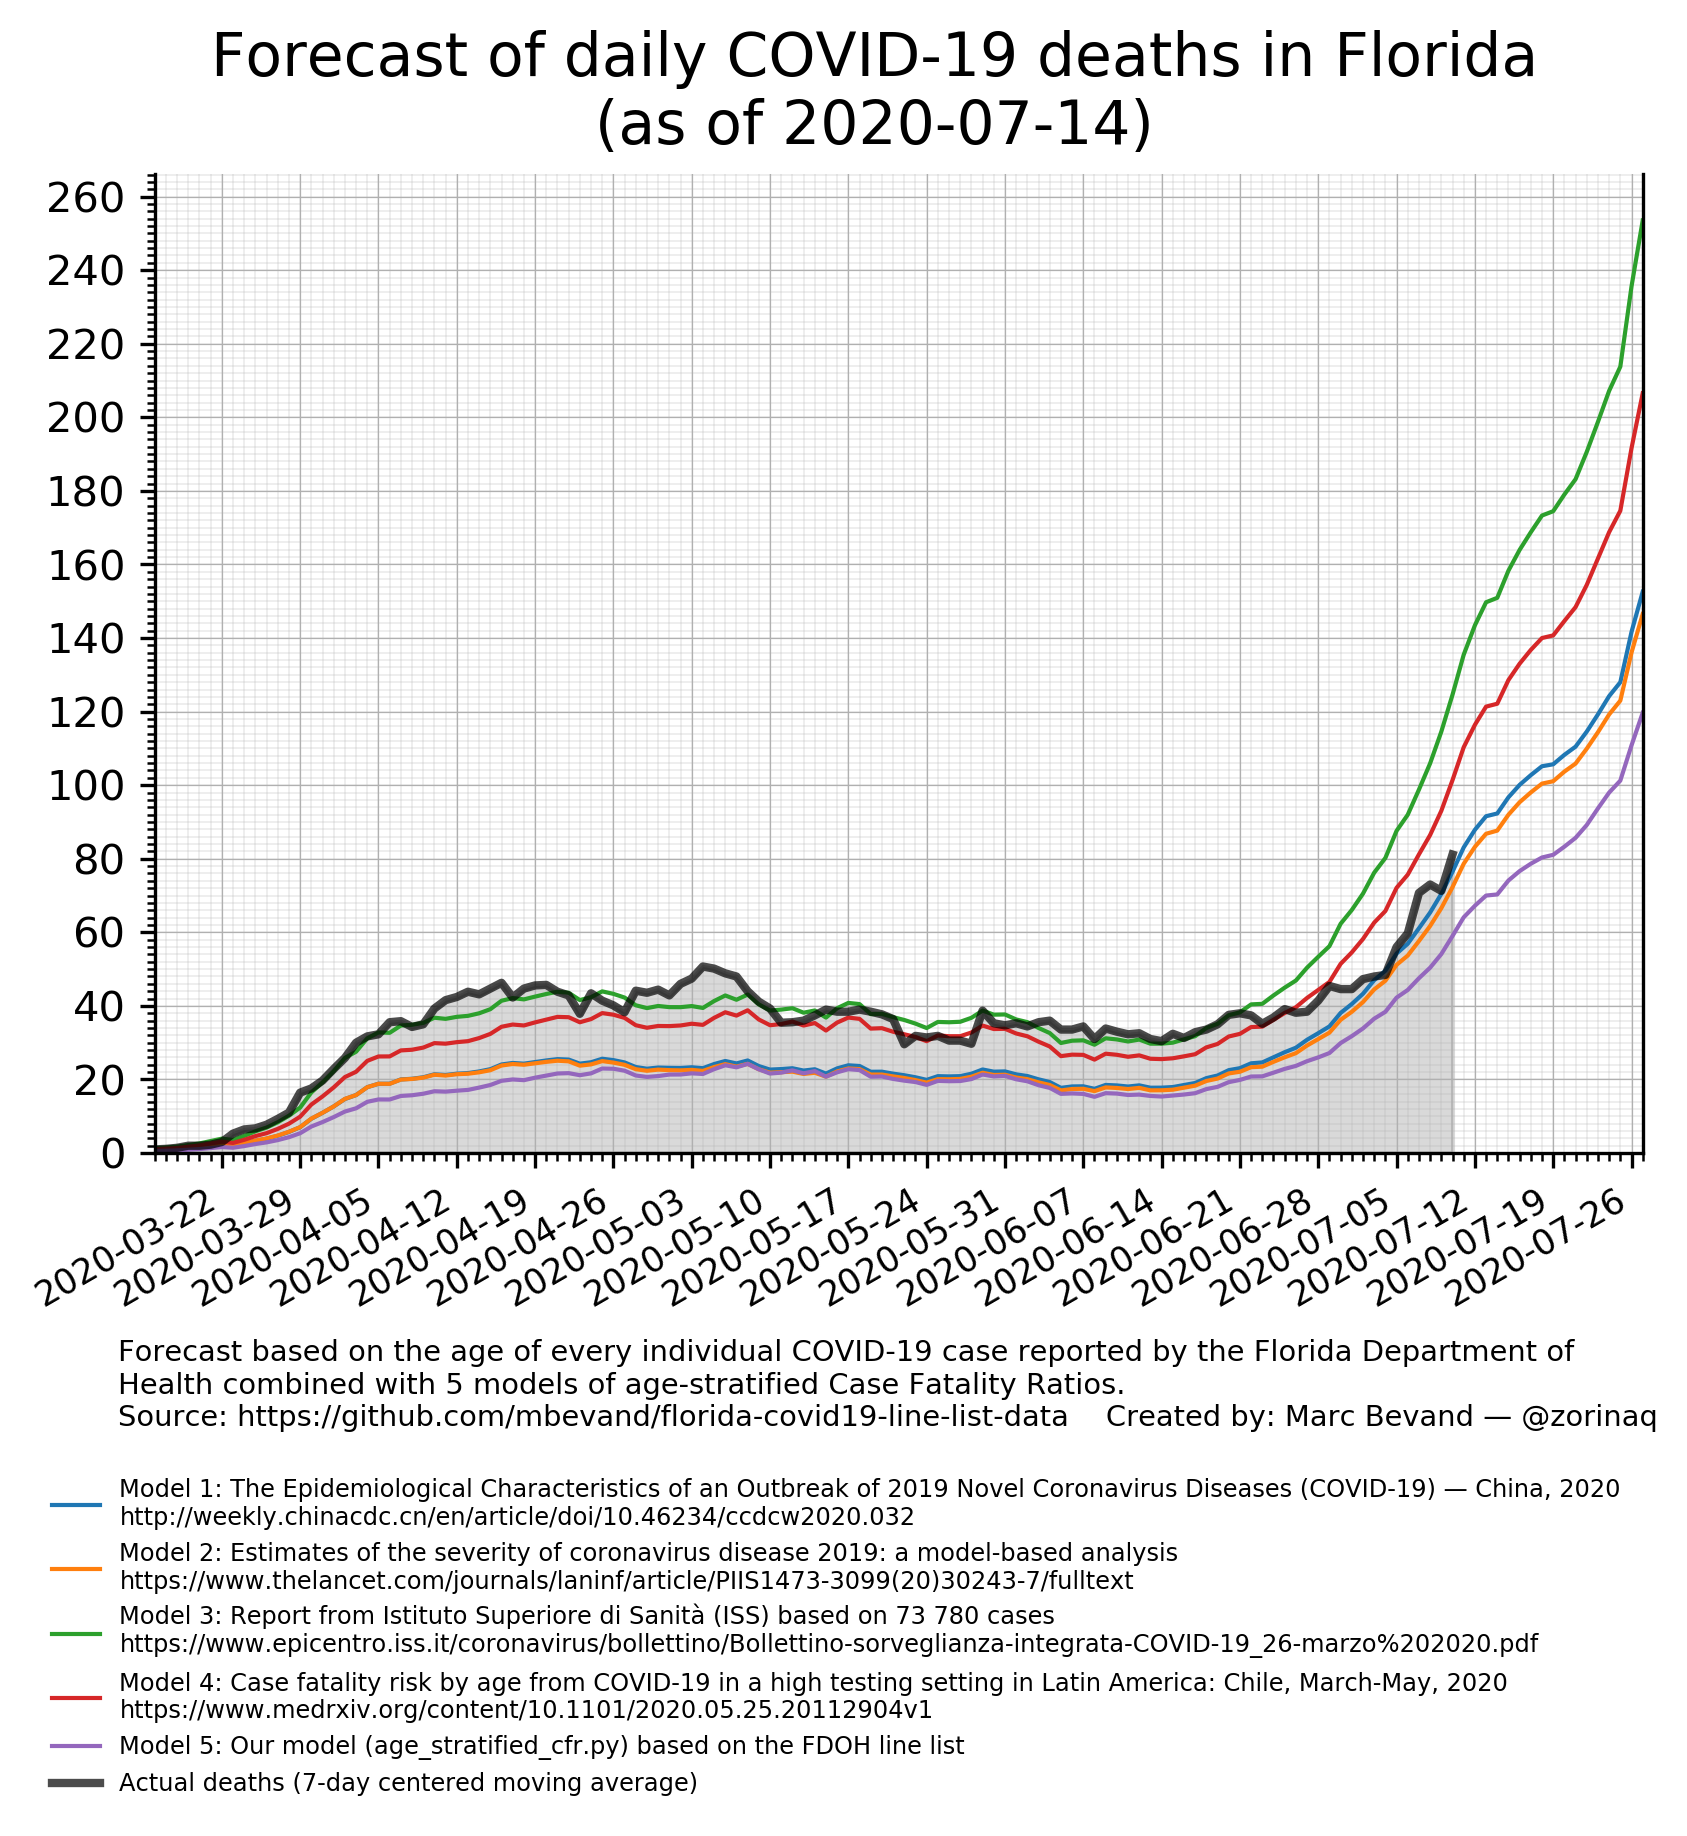
The script multiplies the numbers of cases in specific age brackets by the corresponding age-stratified CFR. The age-stratified CFR estimates are issued from 5 independent models:
- Model 1: The Epidemiological Characteristics of an Outbreak of 2019 Novel Coronavirus Diseases (COVID-19) — China, 2020 (table 1, Case fatality rate)
- Model 2: Estimates of the severity of coronavirus disease 2019: a model-based analysis (table 1, CFR, Adjusted for censoring, demography, and under-ascertainment)
- Model 3: https://www.epicentro.iss.it/coronavirus/bollettino/Bollettino-sorveglianza-integrata-COVID-19_26-marzo%202020.pdf (table 1, Casi totali, % Letalità)
- Model 4: Case fatality risk by age from COVID-19 in a high testing setting in Latin America: Chile, March-May, 2020 (table 2, Latest estimate)
- Model 5: CFR calculated by the script
age_stratified_cfr.py
Since the forecast is based on line list case data, ie. detected cases, it is important that we feed it CFR estimates, not IFR estimates. Infection Fatality Ratios take into account undetected cases and thus would not be consistent with line list data.
Then the script assumes death occurs on average 18.1 days after infection,
which is the mean onset-to-death time calculated by gamma.py.
Finally, it charts the forecast (forecast_deaths.png). The curves are all
smoothed with a 7-day centered moving average.
The end result is a simple tool that can not only predict deaths up to ~18.1 days ahead of time, but can also estimate past deaths accurately: notice how the colored curves in the generated chart follow closely the black curve (actual deaths.)
Historical data for actual deaths was fetched from the New York Times Covid-19
data repository and was saved in the file data_deaths/fl_resident_deaths.csv.
Death data is only used to draw the black curve. It is not used in the
forecasts based on CFR models #1 through #4. Actual deaths are only used
indirectly in the forecast based on model #5, because model #5 uses the
age-stratified CFR calculated from Florida deaths.
Note: since 2020-07-14 the file data_deaths/fl_resident_deaths.csv is now
updated by the script data_fdoh/download that obtains deaths directly from
the FDOH line list. The number of deaths calculated by the script is off by one
from the "Florida Resident Deaths" figure shown on the state's
dashboard because my script only accounts for deaths whose Jurisdiction
is FL resident (consistent with the way NYT does it in their
repository,) whereas the state's dashboard includes 1 additional death
whose Jurisdiction is Not diagnosed/isolated in FL.
age_stratified_cfr.py opens the latest line list CSV file (in directory data_fdoh)
or if no such file exists it downloads it from the FDOH line list page.
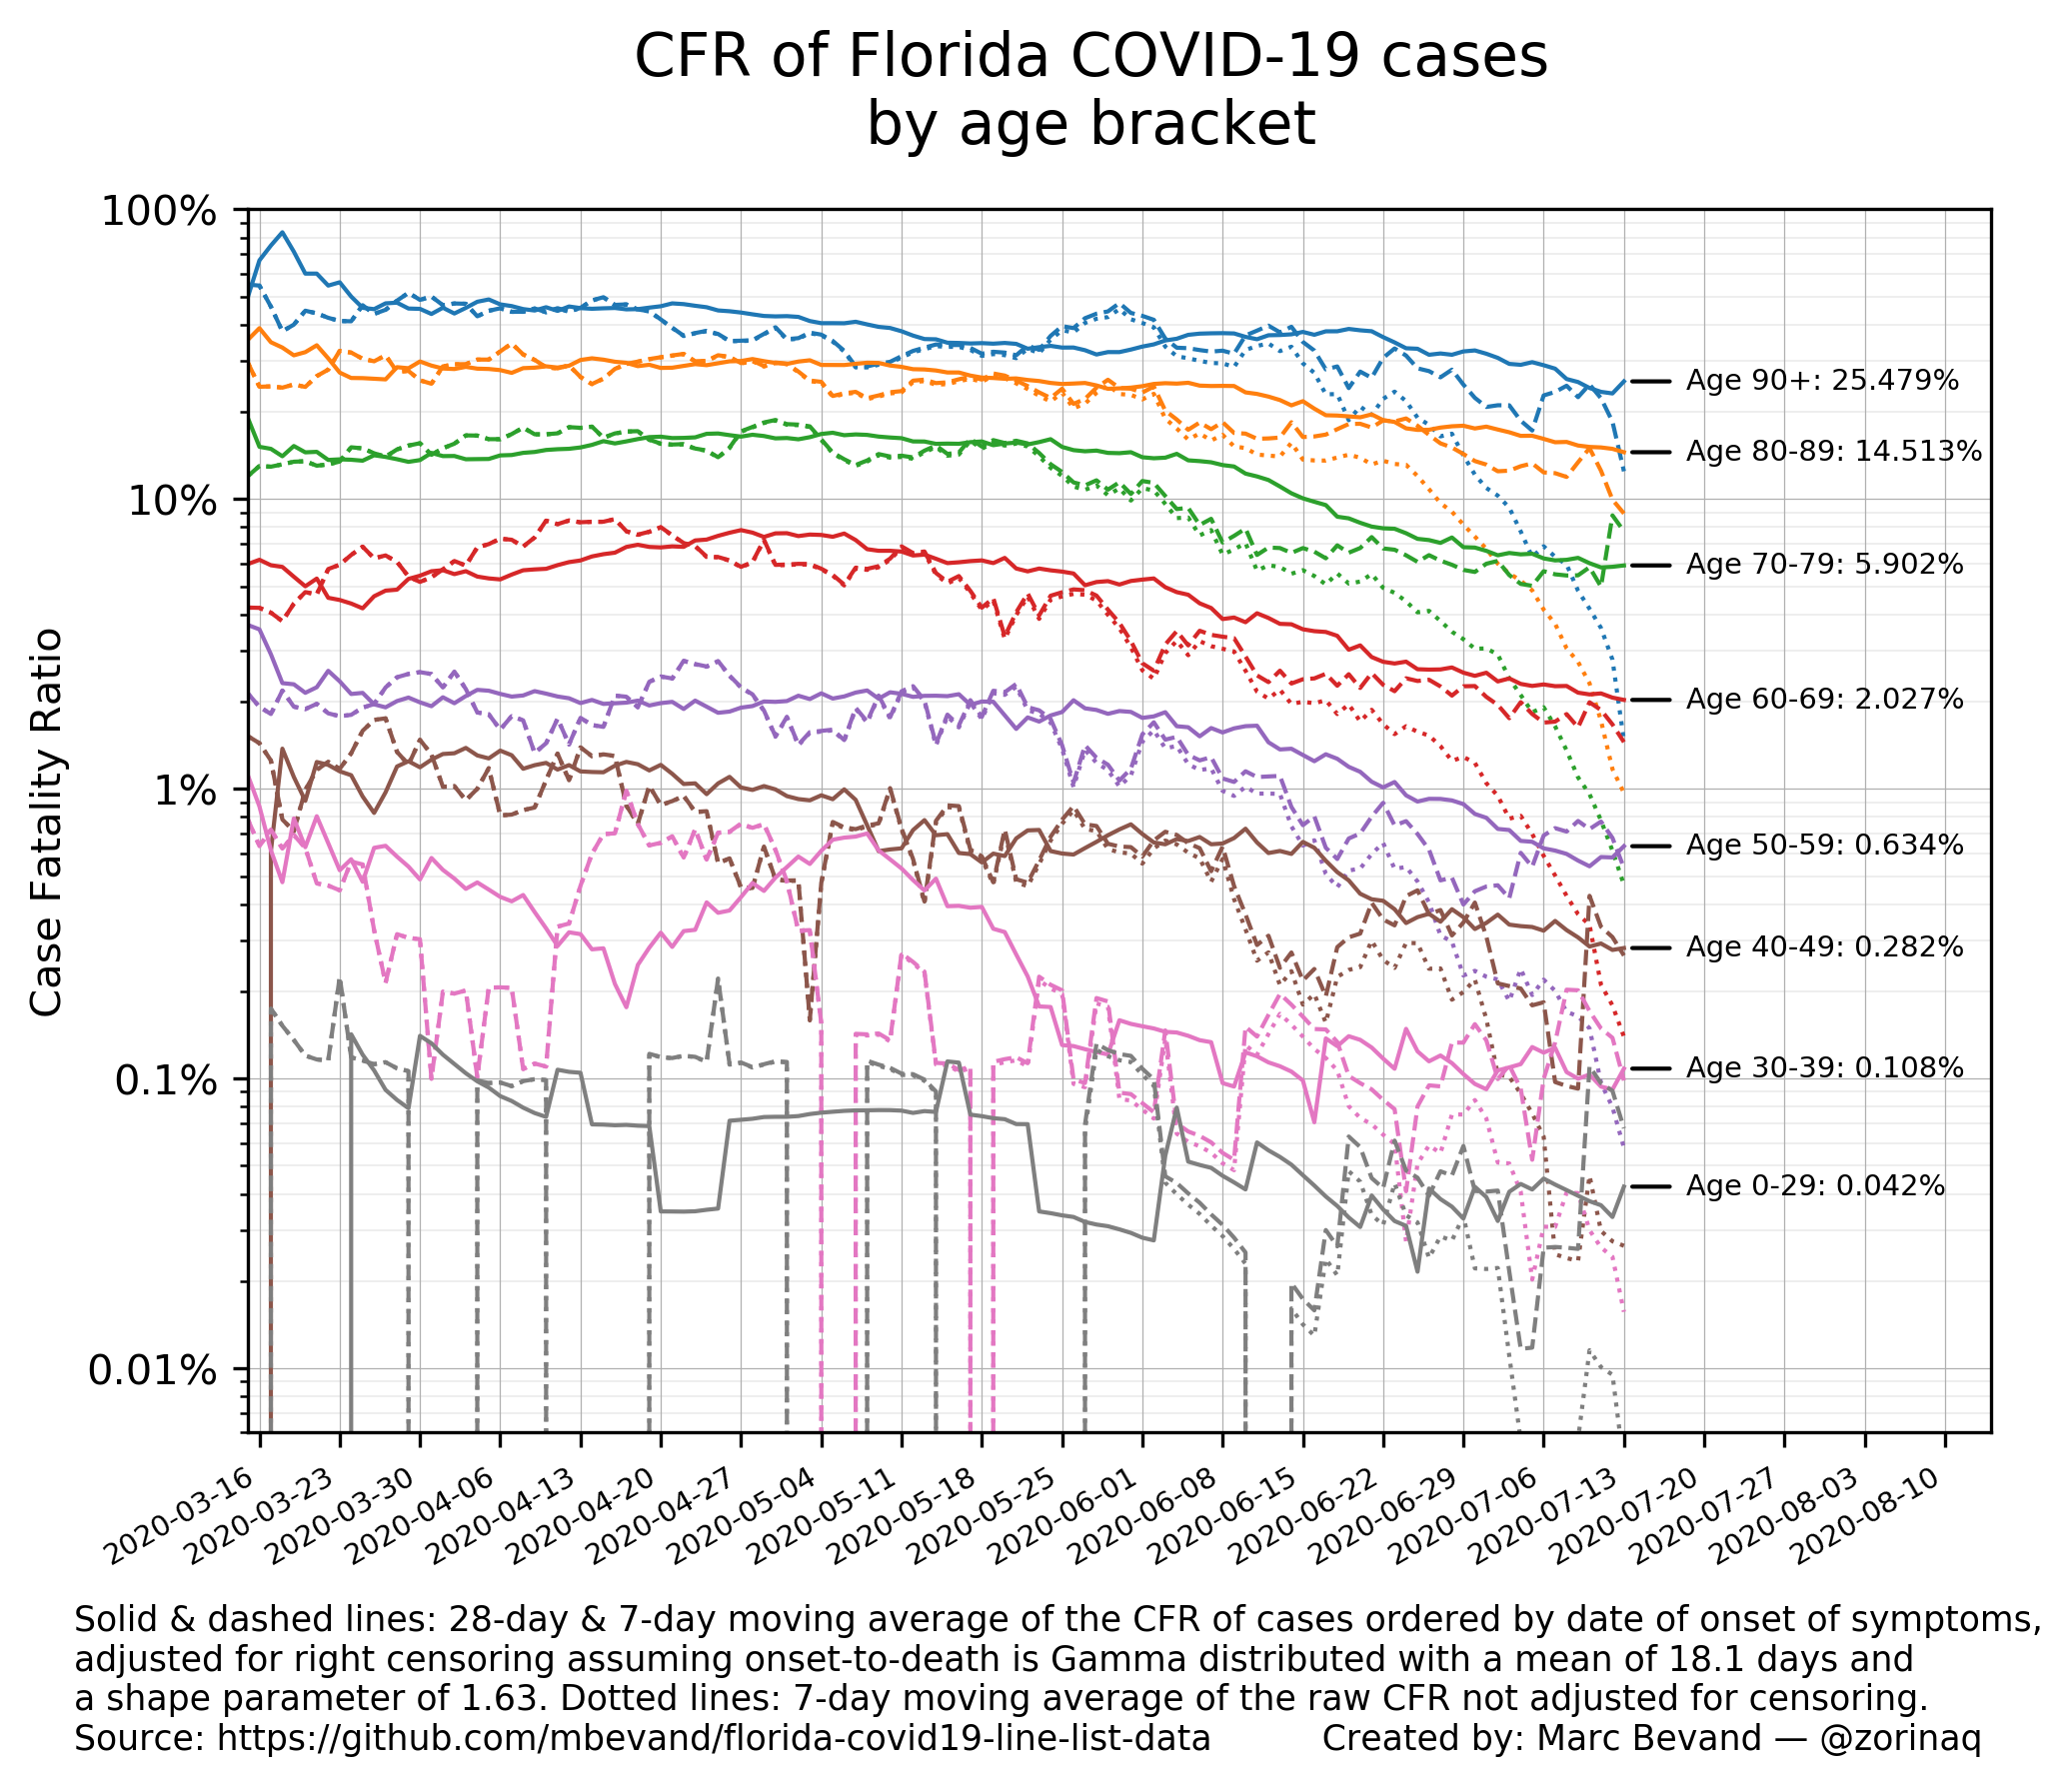
It calculates the 7-day moving average of the raw CFR of various age brackets,
with cases ordered by date of onset of symptoms.
The script also calculates the 7-day (short-term) and 28-day (long-term) moving
average of the CFR ajusted for right censoring. The adjustment is performed by
using the parameters of the Gamma distribution of onset-to-death calculated by
gamma.py.
The results of these calculations are charted in age_stratified_cfr.png.
The short-term adjusted CFR curve helps visualize the magnitude of right censoring: the curve follows the same peaks and valleys as the raw CFR, but deviates more greatly toward the right of the time axis, as censoring increases.
The long-term adjusted CFR curve, especially its last value labelled on the chart, represents our best guess of the age-stratified CFR of COVID-19.
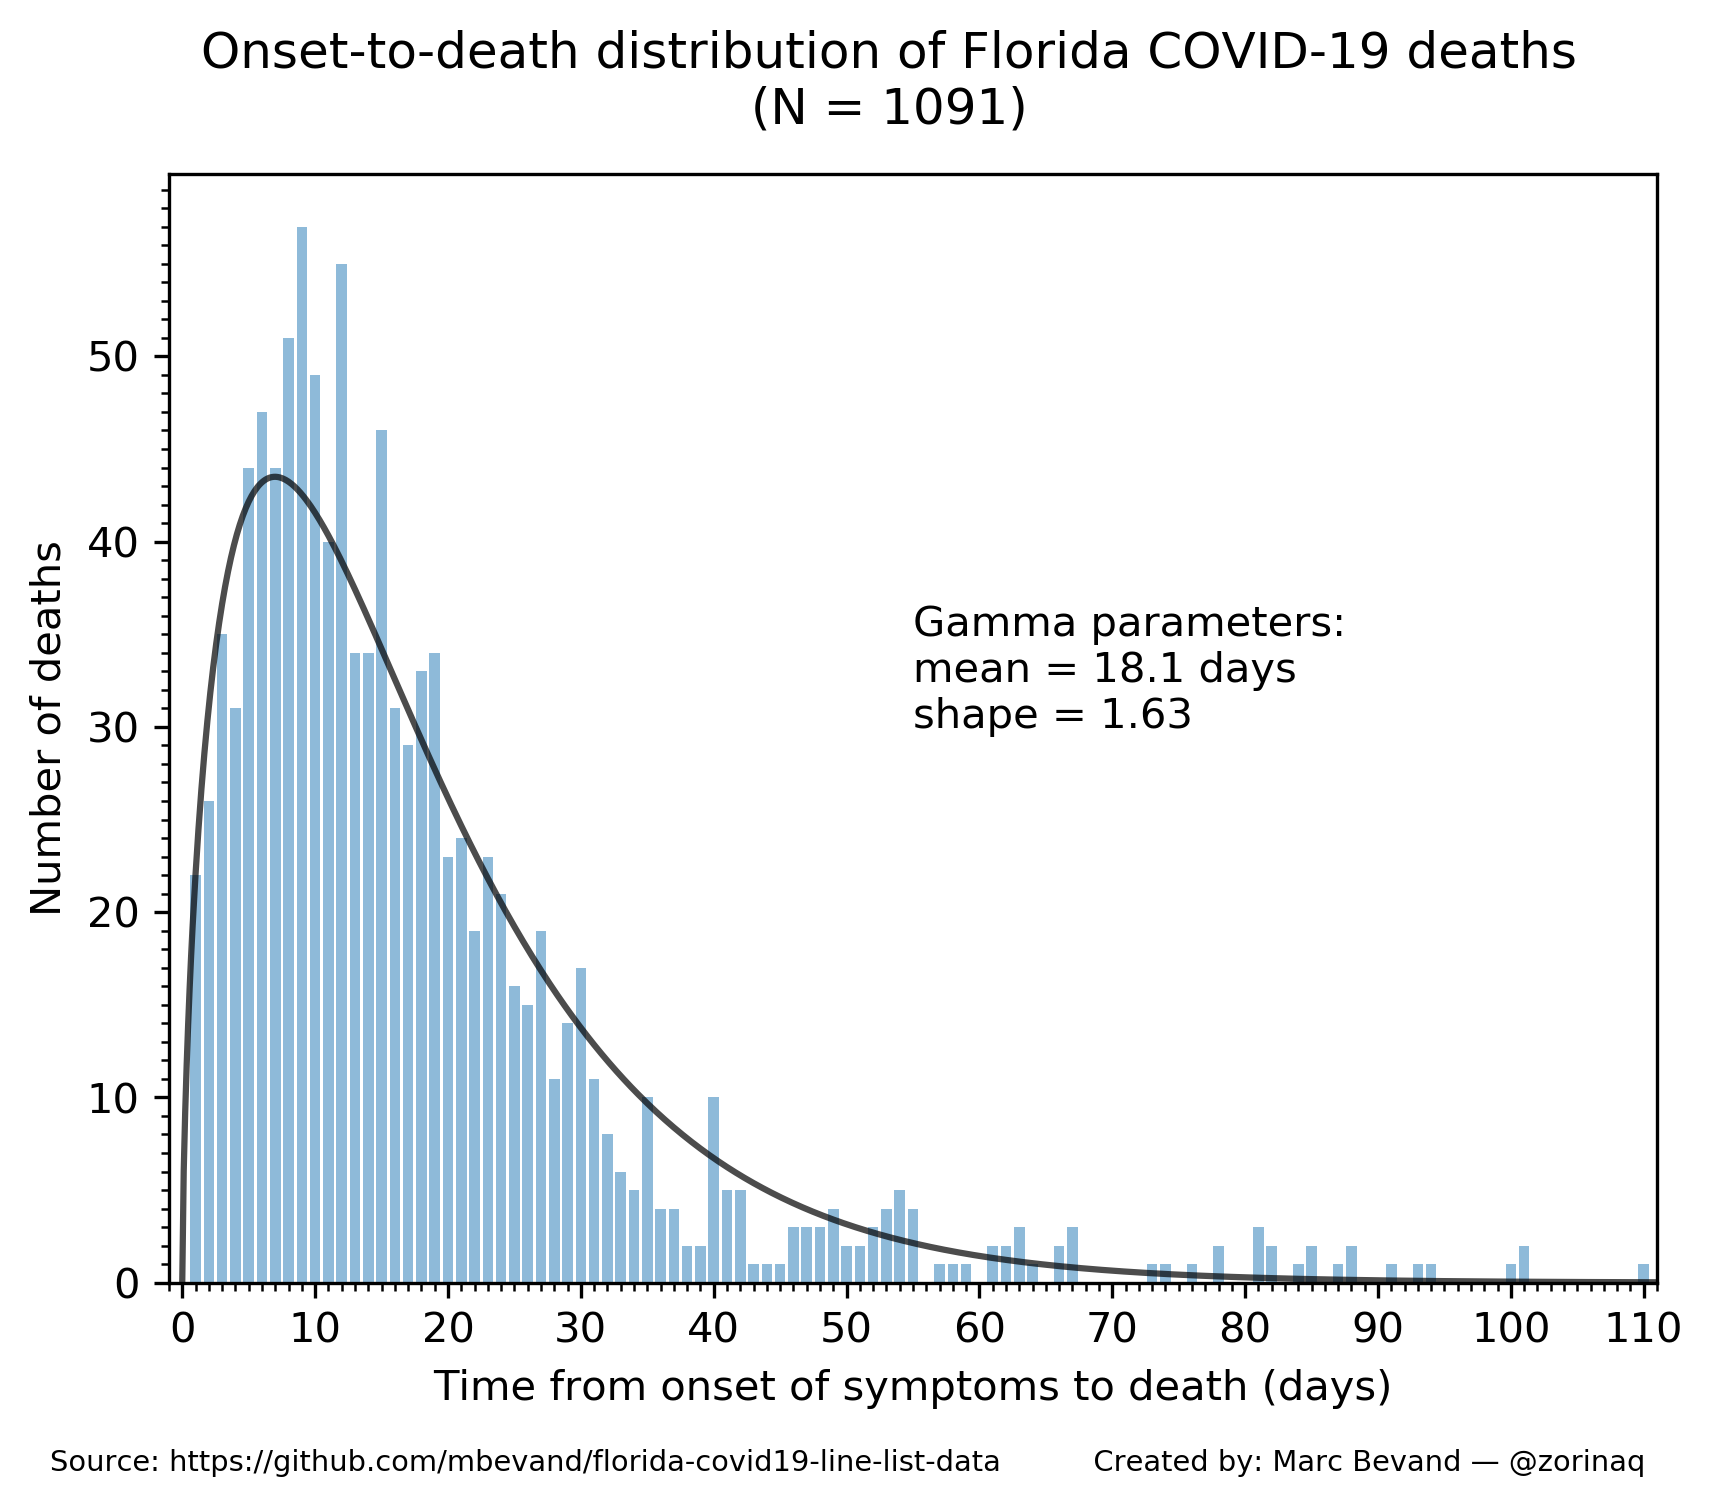
gamma.py calculates the times between onset of symptoms and death
(onset-to-death) and fits them in a Gamma distribution. It creates
a chart (gamma.png) and outputs a numerical summary.
The date of onset is known (EventDate). However FDOH does not publish the
date of death, so gamma.py infers it from updates made to the line list. We
made daily archives of the line list in directory data_fdoh. Pass these files
as arguments to gamma.py, it will parse them, and when it detects a new death
(Died changed to Yes), it infers the date of death was one day before the
line list was updated, because FDOH updates the line list with data as of the
prior day.
$ ./gamma.py data_fdoh/*.csv
Parsing data_fdoh/2020-06-27-00-00-00.csv
Parsing data_fdoh/2020-06-28-00-00-00.csv
Parsing data_fdoh/2020-06-29-09-51-00.csv
Parsing data_fdoh/2020-06-30-19-26-00.csv
Parsing data_fdoh/2020-07-01-07-49-00.csv
Parsing data_fdoh/2020-07-02-13-38-00.csv
Parsing data_fdoh/2020-07-03-09-16-00.csv
Parsing data_fdoh/2020-07-04-13-44-00.csv
Parsing data_fdoh/2020-07-05-08-44-00.csv
Parsing data_fdoh/2020-07-06-08-18-00.csv
Parsing data_fdoh/2020-07-07-09-06-00.csv
Parsing data_fdoh/2020-07-08-10-21-00.csv
Parsing data_fdoh/2020-07-09-11-09-00.csv
Parsing data_fdoh/2020-07-10-09-46-54.csv
Parsing data_fdoh/2020-07-11-11-04-49.csv
Parsing data_fdoh/2020-07-12-09-53-27.csv
Parsing data_fdoh/2020-07-13-07-57-16.csv
Parsing data_fdoh/2020-07-14-12-14-55.csv
Onset-to-death times (in days): [16, 7, 27, 20, 29, 32, 22, 15, 26, 31, 15, 20,
30, 5, 8, 3, 5, 5, 15, 3, 15, 32, 16, 78, 26, 23, 35, 17, 9, 10, 8, 16, 8, 25,
22, 27, 15, 15, 9, 2, 12, 6, 8, 12, 10, 8, 9, 1, 4, 7, 24, 23, 84, 24, 74, 24,
100, 62, 3, 4, 85, 9, 81, 14, 6, 67, 67, 54, 19, 20, 54, 17, 5, 64, 4, 2, 35,
28, 8, 39, 31, 22, 28, 23, 16, 28, 16, 32, 8, 8, 19, 21, 9, 16, 12, 7, 10, 7,
6, 16, 5, 11, 6, 6, 7, 6, 4, 8, 12, 3, 3, 7, 2, 7, 4, 2, 10, 24, 7, 1, 81, 88,
24, 61, 29, 59, 51, 18, 49, 38, 18, 10, 33, 46, 49, 40, 5, 39, 37, 33, 30, 30,
35, 26, 16, 3, 36, 20, 23, 19, 21, 6, 15, 10, 7, 8, 11, 20, 9, 14, 7, 14, 8,
29, 4, 8, 5, 12, 5, 2, 9, 2, 8, 1, 9, 94, 28, 78, 18, 47, 76, 66, 63, 10, 42,
21, 10, 58, 10, 19, 55, 7, 55, 47, 66, 19, 21, 40, 9, 40, 30, 27, 32, 23, 29,
31, 25, 16, 17, 11, 15, 15, 13, 15, 15, 11, 14, 10, 12, 10, 9, 10, 11, 9, 9, 6,
9, 9, 9, 18, 12, 11, 7, 6, 13, 2, 42, 3, 5, 4, 1, 12, 2, 5, 33, 11, 9, 9, 5,
53, 11, 9, 5, 12, 35, 23, 9, 1, 5, 13, 6, 53, 10, 49, 49, 27, 19, 53, 41, 31,
26, 23, 23, 28, 15, 35, 41, 46, 19, 16, 13, 18, 27, 15, 10, 14, 12, 15, 14, 12,
7, 8, 6, 6, 6, 3, 8, 3, 25, 20, 101, 9, 8, 22, 18, 9, 11, 1, 6, 6, 17, 9, 2,
25, 17, 4, 5, 5, 24, 13, 29, 24, 26, 13, 30, 16, 11, 12, 12, 10, 15, 14, 11, 3,
3, 6, 28, 8, 8, 15, 23, 46, 1, 3, 34, 22, 19, 10, 10, 25, 12, 29, 22, 10, 19,
12, 6, 6, 9, 18, 8, 12, 4, 11, 5, 1, 13, 6, 25, 11, 17, 10, 8, 5, 53, 5, 9, 18,
40, 40, 40, 21, 19, 25, 21, 18, 18, 19, 17, 18, 14, 15, 25, 12, 8, 20, 10, 10,
9, 15, 15, 11, 14, 14, 17, 6, 17, 8, 8, 7, 6, 9, 6, 8, 17, 3, 4, 6, 2, 1, 42,
26, 48, 23, 20, 22, 18, 22, 23, 20, 18, 26, 16, 17, 24, 14, 13, 19, 16, 24, 22,
10, 11, 11, 9, 13, 16, 11, 8, 13, 10, 17, 15, 30, 10, 87, 73, 12, 61, 42, 15,
3, 10, 9, 8, 15, 8, 8, 15, 11, 11, 6, 5, 9, 4, 4, 8, 13, 10, 10, 9, 3, 3, 7, 2,
9, 8, 12, 52, 16, 29, 27, 29, 31, 26, 20, 16, 18, 15, 14, 13, 24, 12, 4, 2, 9,
10, 7, 4, 5, 15, 8, 1, 13, 36, 11, 5, 4, 20, 4, 6, 3, 1, 6, 40, 43, 7, 8, 6, 1,
48, 67, 3, 51, 15, 33, 54, 4, 12, 23, 29, 11, 11, 33, 40, 34, 28, 35, 36, 31,
31, 24, 21, 23, 29, 30, 30, 25, 27, 20, 16, 54, 110, 13, 101, 17, 29, 19, 7,
82, 34, 19, 11, 10, 5, 7, 63, 26, 88, 52, 23, 11, 30, 17, 20, 26, 19, 27, 20,
18, 15, 17, 18, 17, 21, 22, 16, 15, 12, 13, 15, 14, 18, 13, 14, 14, 12, 17, 17,
18, 13, 14, 14, 19, 10, 9, 11, 14, 12, 10, 12, 8, 8, 12, 9, 7, 7, 8, 8, 7, 7,
10, 8, 8, 8, 13, 12, 11, 5, 10, 6, 12, 2, 6, 12, 1, 2, 12, 6, 3, 2, 12, 2, 3,
1, 2, 1, 8, 1, 5, 11, 19, 8, 85, 12, 28, 16, 7, 7, 7, 22, 6, 22, 7, 2, 45, 16,
35, 35, 29, 25, 31, 24, 24, 29, 33, 30, 32, 82, 27, 24, 25, 18, 31, 16, 22, 19,
19, 15, 15, 20, 18, 15, 14, 26, 15, 22, 15, 13, 14, 12, 27, 13, 15, 14, 13, 9,
11, 12, 9, 12, 12, 11, 9, 10, 8, 9, 9, 7, 14, 23, 7, 7, 10, 14, 11, 5, 9, 15,
6, 6, 5, 18, 5, 3, 4, 6, 9, 4, 3, 2, 8, 8, 20, 3, 10, 10, 11, 20, 1, 19, 16, 2,
20, 91, 54, 55, 6, 30, 6, 10, 9, 62, 13, 40, 9, 21, 3, 50, 44, 34, 37, 35, 25,
30, 50, 34, 24, 31, 27, 21, 26, 63, 26, 28, 29, 31, 23, 27, 32, 20, 21, 30, 21,
21, 19, 19, 22, 22, 15, 17, 16, 17, 17, 19, 14, 27, 17, 27, 14, 14, 11, 15, 14,
13, 18, 23, 16, 13, 10, 11, 12, 8, 12, 18, 10, 21, 12, 12, 8, 9, 5, 4, 6, 13,
11, 7, 5, 4, 9, 6, 2, 12, 2, 2, 1, 5, 9, 14, 13, 3, 1, 1, 10, 42, 57, 15, 21,
47, 48, 15, 21, 27, 37, 24, 22, 28, 5, 25, 22, 21, 27, 19, 15, 18, 23, 16, 13,
12, 11, 14, 16, 12, 13, 11, 12, 12, 7, 9, 5, 7, 7, 7, 3, 6, 5, 5, 1, 2, 30, 5,
22, 4, 4, 30, 30, 14, 41, 35, 27, 24, 21, 23, 18, 19, 18, 19, 16, 30, 18, 20,
18, 14, 17, 12, 10, 12, 10, 7, 14, 2, 10, 9, 7, 10, 9, 18, 5, 93, 23, 14, 24,
81, 6, 11, 16, 2, 41, 5, 10, 21, 21, 40, 37, 36, 55, 27, 38, 41, 28, 32, 26,
25, 25, 27, 25, 21, 23, 21, 20, 23, 19, 18, 26, 17, 19, 20, 18, 32, 19, 18, 19,
24, 19, 17, 20, 23, 16, 17, 18, 24, 16, 24, 15, 21, 12, 15, 19, 16, 14, 17, 13,
12, 15, 13, 13, 11, 21, 13, 19, 15, 19, 12, 52, 12, 15, 17, 13, 11, 9, 12, 17,
9, 10, 10, 7, 11, 8, 8, 9, 6, 9, 10, 7, 9, 7, 7, 9, 9, 8, 8, 6, 6, 5, 5, 6, 6,
6, 6, 12, 7, 4, 5, 9, 12, 5, 13, 5, 4, 4, 7, 3, 3, 8, 7, 3, 3, 12, 4, 4, 3, 4,
4, 3, 3, 3, 3, 5, 1, 5, 4]
Number of deaths: 1091
Gamma distribution params:
mean = 18.1
shape = 1.63
A mean of 18.1 days is comparable to other published estimates, however our distribution is wider (ie. smaller shape parameter of 1.63) because many deaths occur in the long tail:
- mean 17.8 days, shape 4.94 = 0.45-2, based on sample of 24 deaths: Estimates of the severity of coronavirus disease 2019: a model-based analysis
- mean 15.1 days, shape 5.1, based on sample of 3 deaths: Estimating case fatality ratio of COVID-19 from observed cases outside China
We believe our distribution parameters are more accurate because they are based on a much larger sample of 864 deaths. The long tail may be the result of improved treatments that can maintain patients alive for a longer time.
Limitations: it is likely our technique does not always accurately identify the
date of death. For example FDOH could be updating the line list many days after
the death occured (contributing to the long tail.) Furthermore, there are data
quality issues in the EventDate column of the FDOH line list, meaning this
date does not always accurately reflect the date of onset.
heatmap.py opens the latest line list CSV file (in directory data_fdoh)
or if no such file exists it downloads it from the FDOH line list page.
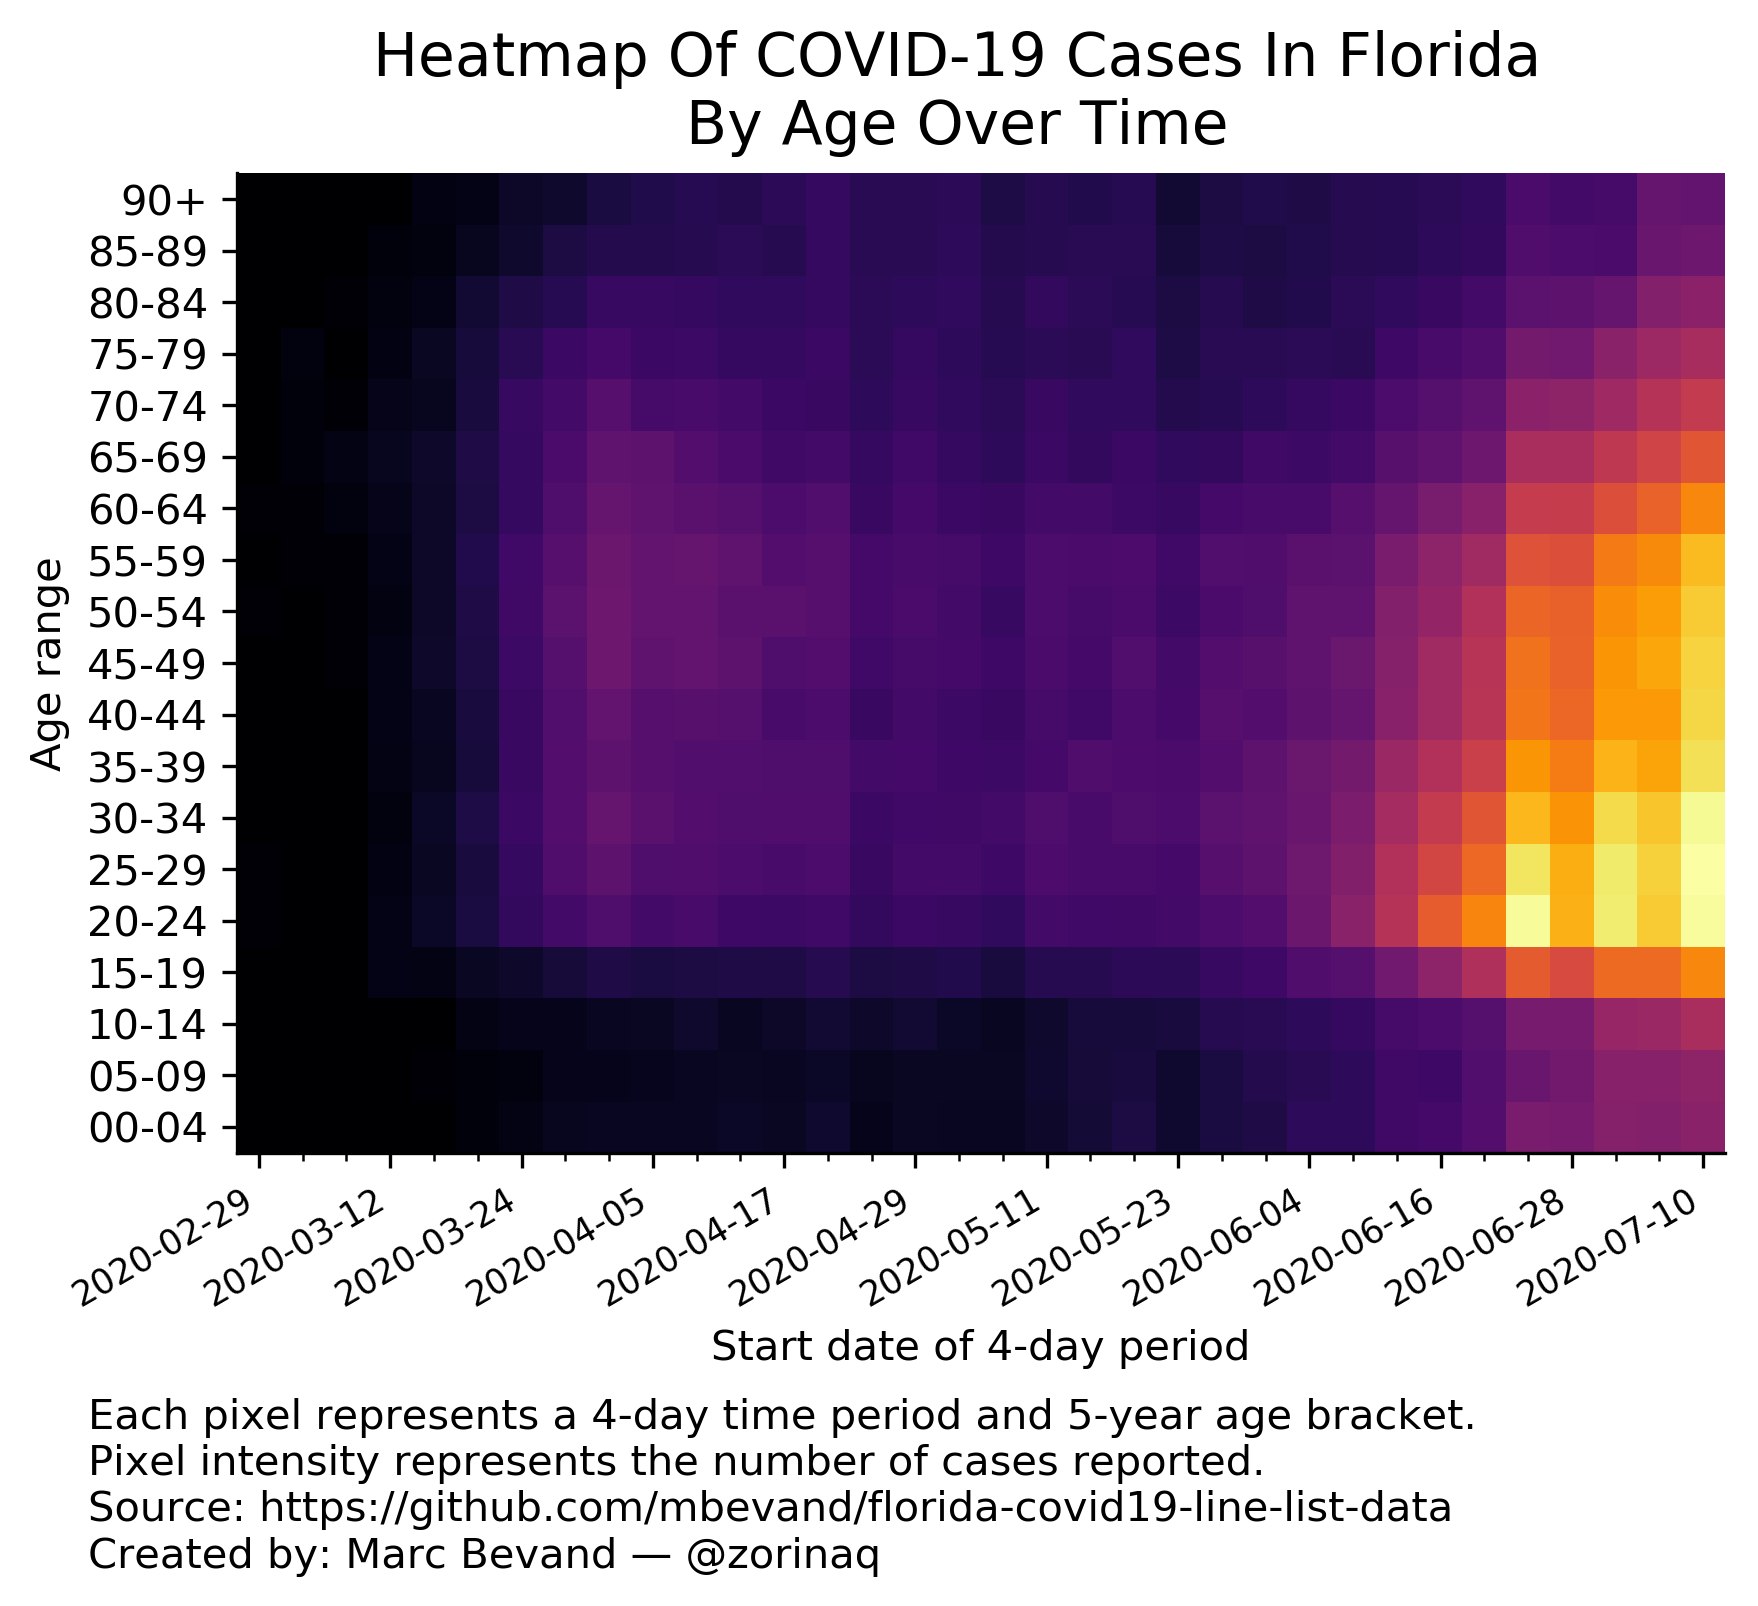
It creates the heatmap (heatmap.png) of cases by date reported, by age
bracket, and also produces a numerical summary of age trends over time:
$ ./heatmap.py
Opening data_fdoh/2020-07-14-14-09-16.csv
Number of COVID-19 cases per 4-day time period in Florida by age bracket over time:
period_start, 00-04, 05-09, 10-14, 15-19, 20-24, 25-29, 30-34, 35-39, 40-44, 45-49, 50-54, 55-59, 60-64, 65-69, 70-74, 75-79, 80-84, 85-89, 90+, median_age
  2020-02-29,     0,     0,     0,     0,     1,     1,     0,     0,     0,     0,     1,     0,     1,     0,     0,     0,     0,     0,     0,  41.5
  2020-03-04,     0,     0,     0,     0,     0,     0,     0,     0,     0,     0,     0,     1,     1,     2,     2,     3,     0,     0,     0,  71.0
  2020-03-08,     0,     0,     0,     0,     0,     0,     0,     0,     0,     1,     1,     1,     3,     7,     1,     0,     1,     0,     0,  67.0
  2020-03-12,     0,     0,     0,     8,     9,     6,     3,     7,     8,     9,     4,     9,    10,    15,    10,     6,     3,     2,     0,  55.0
  2020-03-16,     0,     1,     0,     7,    24,    21,    22,    16,    18,    29,    27,    25,    25,    28,    15,    20,     8,     3,     6,  51.0
  2020-03-20,     2,     2,     7,    20,    60,    55,    72,    53,    57,    65,    73,    82,    66,    76,    57,    53,    43,    15,     8,  52.0
  2020-03-24,     7,     3,    11,    28,   134,   141,   168,   164,   165,   175,   188,   196,   151,   140,   155,   104,    76,    32,    27,  50.0
  2020-03-28,    15,    11,    11,    47,   204,   273,   296,   291,   287,   306,   338,   315,   262,   238,   209,   167,   100,    64,    32,  49.0
  2020-04-01,    18,    11,    19,    73,   265,   354,   421,   347,   381,   460,   458,   446,   422,   365,   310,   216,   156,    90,    60,  50.0
  2020-04-05,    19,    14,    20,    60,   207,   269,   334,   315,   310,   374,   381,   381,   358,   349,   227,   172,   152,    91,    79,  51.0
  2020-04-09,    18,    17,    33,    65,   230,   277,   292,   287,   326,   383,   395,   400,   330,   294,   233,   180,   140,    93,   101,  51.0
  2020-04-13,    23,    20,    19,    76,   183,   248,   262,   287,   302,   351,   328,   368,   303,   242,   205,   150,   131,   111,    87,  51.0
  2020-04-17,    21,    19,    27,    76,   176,   234,   273,   267,   234,   263,   328,   293,   252,   191,   168,   151,   128,    93,   115,  50.0
  2020-04-21,    35,    22,    39,    95,   201,   248,   273,   266,   250,   293,   308,   316,   280,   210,   164,   169,   150,   139,   141,  51.0
  2020-04-25,    12,    16,    29,    65,   136,   162,   167,   209,   159,   199,   211,   212,   160,   145,   123,   114,   110,   107,   107,  51.0
  2020-04-29,    21,    20,    38,    73,   172,   204,   199,   211,   207,   224,   236,   231,   212,   199,   153,   145,   122,   107,   105,  51.0
  2020-05-03,    18,    21,    22,    82,   158,   207,   190,   182,   178,   215,   204,   222,   168,   145,   131,   125,   129,   124,   115,  51.0
  2020-05-07,    19,    20,    18,    56,   132,   185,   203,   173,   164,   184,   158,   183,   160,   123,   111,   101,    92,    90,    68,  48.0
  2020-05-11,    29,    34,    31,    97,   206,   257,   270,   216,   227,   243,   247,   245,   204,   171,   159,   111,   138,    93,    97,  48.0
  2020-05-15,    44,    47,    53,    97,   199,   233,   233,   271,   199,   216,   221,   241,   209,   136,   132,   105,   113,   105,    86,  47.0
  2020-05-19,    65,    57,    53,   120,   189,   229,   269,   256,   245,   288,   236,   253,   178,   171,   128,   132,   101,   104,   101,  46.0
  2020-05-23,    36,    36,    58,   111,   210,   214,   252,   236,   212,   209,   175,   199,   158,   128,    88,    70,    64,    53,    43,  42.0
  2020-05-27,    62,    63,    94,   155,   249,   313,   341,   293,   309,   297,   243,   286,   215,   135,    98,   107,    96,    72,    66,  42.0
  2020-05-31,    73,    87,   103,   183,   297,   355,   360,   351,   296,   320,   268,   276,   229,   193,   124,   106,    74,    65,    81,  41.0
  2020-06-04,   124,   104,   126,   272,   450,   479,   424,   437,   349,   366,   368,   333,   229,   174,   143,   112,    85,    81,    74,  39.0
  2020-06-08,   124,   125,   150,   299,   704,   623,   579,   509,   419,   439,   370,   339,   315,   209,   170,   104,   113,    93,    96,  37.0
  2020-06-12,   193,   190,   224,   483,  1160,  1106,   970,   850,   687,   659,   645,   566,   408,   319,   246,   181,   132,   100,    98,  36.0
  2020-06-16,   218,   187,   251,   735,  1976,  1569,  1328,  1110,   918,   918,   794,   725,   555,   368,   300,   231,   163,   125,   109,  35.0
  2020-06-20,   292,   286,   304,  1097,  2635,  2192,  1871,  1439,  1194,  1190,  1106,   919,   680,   466,   375,   274,   208,   136,   129,  34.0
  2020-06-24,   557,   426,   533,  1960,  4780,  4268,  3459,  2889,  2393,  2330,  2138,  1800,  1358,  1014,   719,   505,   343,   278,   236,  35.0
  2020-06-28,   532,   502,   536,  1644,  3357,  3302,  2859,  2486,  2155,  2077,  2063,  1743,  1386,  1021,   742,   487,   353,   251,   204,  37.0
  2020-07-02,   657,   676,   814,  2215,  4421,  4392,  4048,  3393,  2944,  2912,  2752,  2468,  1745,  1274,   907,   704,   412,   236,   227,  36.0
  2020-07-06,   642,   675,   845,  2214,  3789,  3894,  3669,  3145,  2951,  3163,  3011,  2718,  2081,  1519,  1165,   879,   636,   430,   402,  40.0
  2020-07-10,   706,   743,  1021,  2663,  4826,  4918,  4752,  4147,  3988,  3925,  3793,  3533,  2663,  1867,  1337,  1001,   718,   465,   379,  39.0
(Last period's data may be incomplete. Age unknown for 587 out of 291629 cases.)
The number of cases is increasing among all age brackets. However the median age of cases is declining because younger people appear to be driving increased transmission, especially the 20-24 age bracket.
By default the size of each pixel, or bucket, is 5-year age brackets and 4-day
time periods. This can be changed by editing the variables buckets_ages and buckets_days
in heatmap.py.
heatmap.py also creates heatmap_age_share.png: the pixel intensity represents
not the number of cases, but the share of cases in this age bracket among all
cases reported in this time period.
sort.py is a tool that strips the ObjectId column from a line list CSV file
and sorts the rows. This is helpful to compare 2 CSV files published on 2
different days, because the ObjectId value and the order of rows are not
stable from one file to another.


