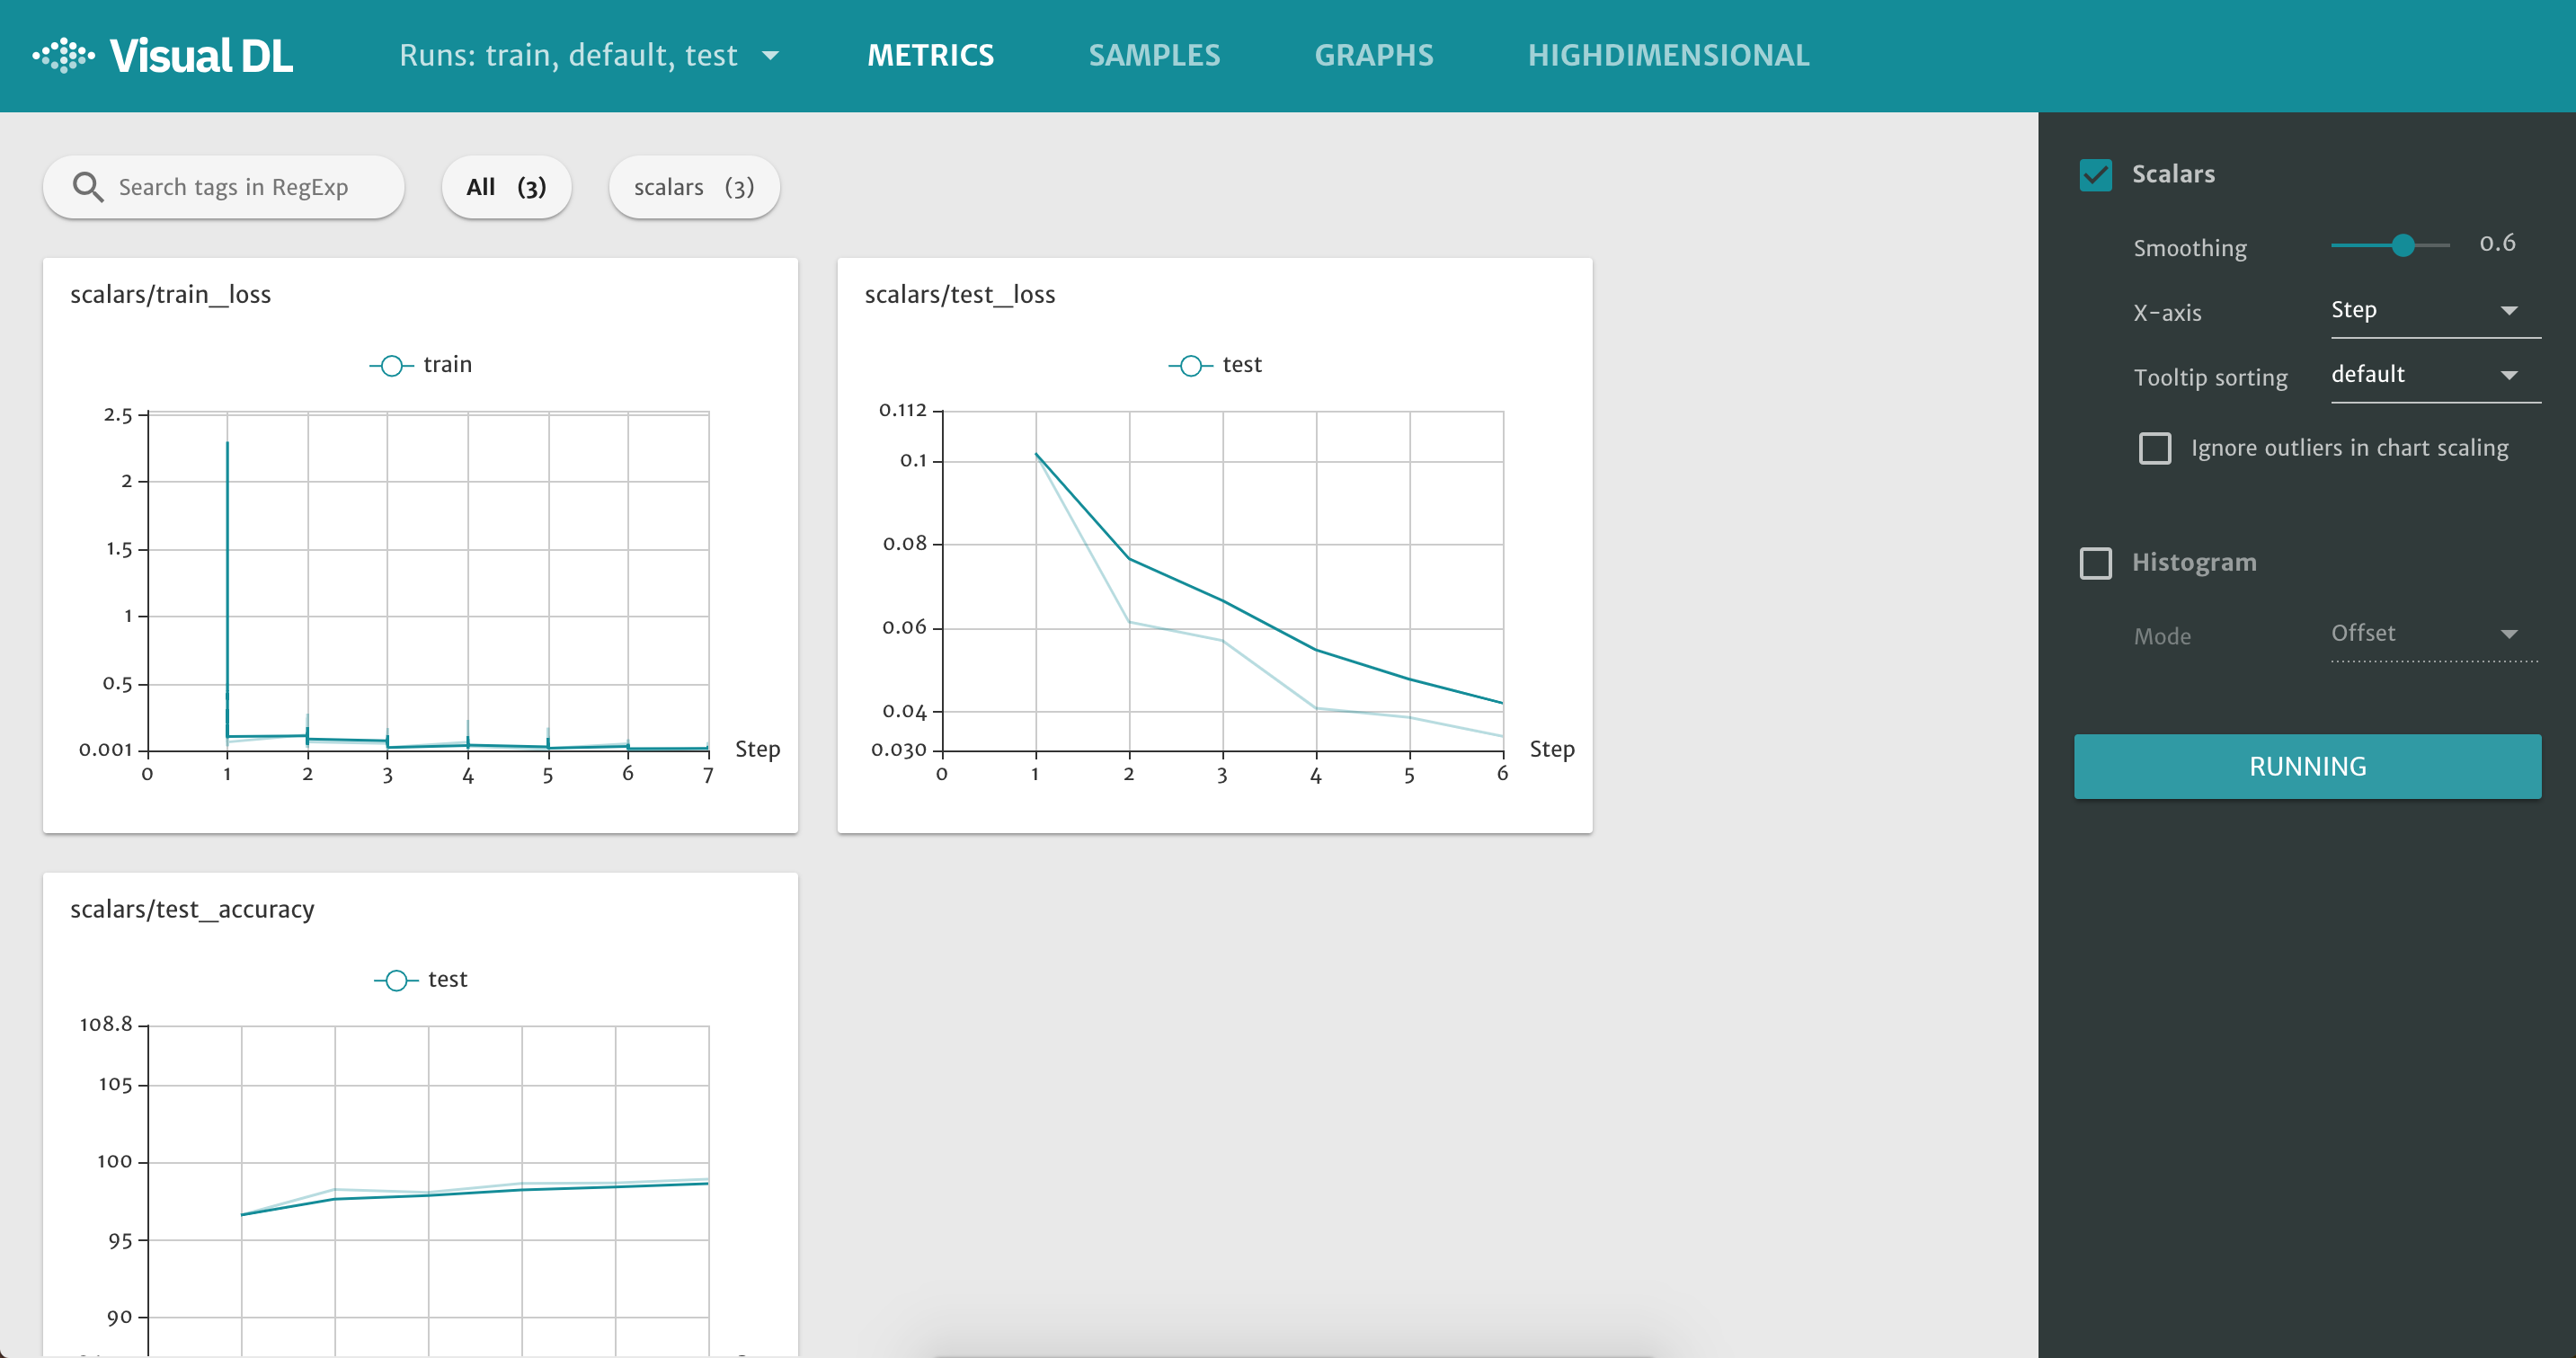
This repository contains two scripts: one (write_visualdl_data.py) can be used to visualize statistics (or metrics) of a PyTorch model (a CNN trained and tested on MNIST) and the other (read_visualdl_data.py) to retrieve or read those statistics once they have been logged to a file. This codebase is associated with this blog post.
These instructions are for Mac users, in particular, the ones using Mac OS X High Sierra (version 10.13.6). However, these instructions should also work for (at least) Linux users.
For this example, I used Anaconda: I run the example inside an Anaconda environment. I also used PyCharm as my IDE.
You can download Anaconda from here. You should download the version for Python 3.7. Once it is downloaded, you can open a terminal window and type the following command to create a Anaconda environment (where we will install the dependencies we need to execute the example):
conda create --name visualdl_with_pytorch python=3.6
This will create a Conda environment called visualdl_with_pytorch, where the Python version that will be used in that environment is 3.6.
We need now to "activate" this environment using the command, before installing any dependency:
conda activate visualdl_with_pytorch
Your terminal prompt should now look something like this
(visualdl_with_pytorch) YourName$
The prefix (visualdl_with_pytorch) means that the Conda environment visualdl_with_pytorch is activated.
We can now install PyTorch and its sub-module called torchvision, using the command:
conda install pytorch torchvision -c pytorch
You then can also install VisualDL, but we install it using pip:
pip install --upgrade visualdl
We should now be ready to run the example write_visualdl_data.py.
If you are using PyCharm (version 2018.3.2), I recommend you start it from the terminal with the command charm (which should be available, if you installed this version of PyCharm). This recommendation is due to the fact that I encountered a problem related to the integrated PyCharm terminal, if I do not start it from the terminal (e.g., the conda command was not being recognized from within the integrated terminal). If you are using PyCharm, once you are inside, make sure that the Python interpreter of the project is pointing to the Python interpreter of the Conda environment just created. See https://www.jetbrains.com/help/pycharm/configuring-python-interpreter.html for more info on how to do this (in general).
Once the Python interpreter is also properly set up, you can finally run the example write_visualdl_data.py. After having run the example, you should first see that the MNIST dataset is being downloaded and then you will start to see an output like
Train Epoch: 1 [0/60000 (0%)]	Loss: 2.300039
Train Epoch: 1 [640/60000 (1%)]	Loss: 2.213470
Train Epoch: 1 [1280/60000 (2%)]	Loss: 2.170460
Train Epoch: 1 [1920/60000 (3%)]	Loss: 2.076699
Train Epoch: 1 [2560/60000 (4%)]	Loss: 1.868078
Train Epoch: 1 [3200/60000 (5%)]	Loss: 1.414202
...
This example write_visualdl_data.py is modification of the PyTorch example whose source code can be found here.
You will notice, after about 1 minute, that a folder called log will be created under this project directory. This folder is the output of VisualDL. Once this folder is created, we can finally start VisualDL. You can start it using the command (on a terminal where our Conda environment is activated)
visualDL --logdir ./log --port 8080
Here, ./log refers to the folder containing the logging files produced by VisualDL.
You can now go to the following URL:
http://0.0.0.0:8080/
You should now see something like:
If the plots are still empty, please, wait a little bit more. It seems that VisualDL is not completely real-time yet. See this issue.
You can now look at the source code of this example to see how VisualDL is being used to visualize some statistics regarding the model.
Meanwhile, what you can also do is read the logging data produced by VisualDL using the Python script read_visualdl_data.py. If you are using PyCharm, you can run this script while the other is also being run, without interference. Just make sure that you call this script once the log folder is created. You can then use this retrieved previously logged data e.g. to plot it again, but using e.g. Matplotlib.
