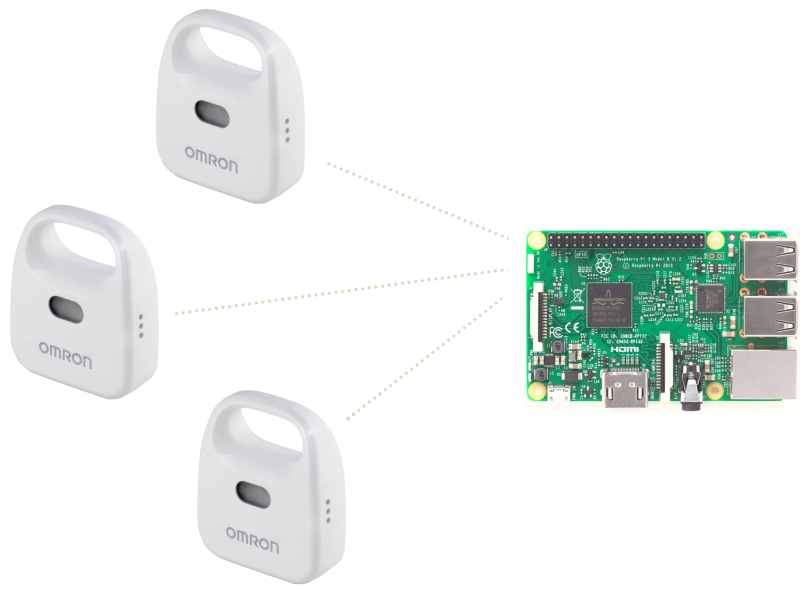
Python Bluetooth low energy observer example for OMRON Environment Sensor (2JCIE-BL01).
- No BLE connections are required
- Accept advertisements from multiple sensor
- Collect variety of environmental information from sensor beacon
- Temperature
- Humidity
- Light
- UV Index
- Absolute pressure
- Noise (Sound level)
- 3-Axis Acceleration
- Discomfort Index
- Heatstroke risk indicator
- Battery voltage
- RSSI
- Flexible data logging options
- Tested on Raspberry Pi 3 model B (built-in Bluetooth connectivity)
- BlueZ libraries
- python 2.7
- python-bluez
- fluent-logger-python (Optional)
- influxdb-python (Optional)
These instructions apply only to an up-to-date Raspbian Jessie with PIXEL, the official Raspberry PI distro.
$ sudo apt-get install python-bluez
When using fluentd forwarder (Optional)
$ sudo pip install fluent-logger
When uploading data to influxDB 0.9 or higher (Optional)
$ sudo pip install influxdb
$ sudo pip install --upgrade influxdb
Environment Sensor (2JCIE-BL01) must be configured as a beacon broadcaster (IM/EP).
In this mode of operation, sensor data is included in the advertisement packet to be transmitted.
Please refer to communication interface manual for more details.
Open conf.py and edit your configuration.
CSV is saved under ./log/ directory in the script path by default.
You can specify a different log location in your configuration.
- Normal mode
Only sensor status information is sent to stdout in a set interval.
$ sudo ./envsensor_observer.py
You need to make
envsensor_observer.pyexecutable.You can use Supervisor to start the script running in the background when system boot.
- Debug mode
Full Bluetooth messages are sent to stdout in addition to the sensor status.
$ sudo ./envsensor_observer.py --debug
or
$ sudo ./envsensor_observer.py -d
With Grafana, you can easily visualize any of data stored in InfluxDB through this script.
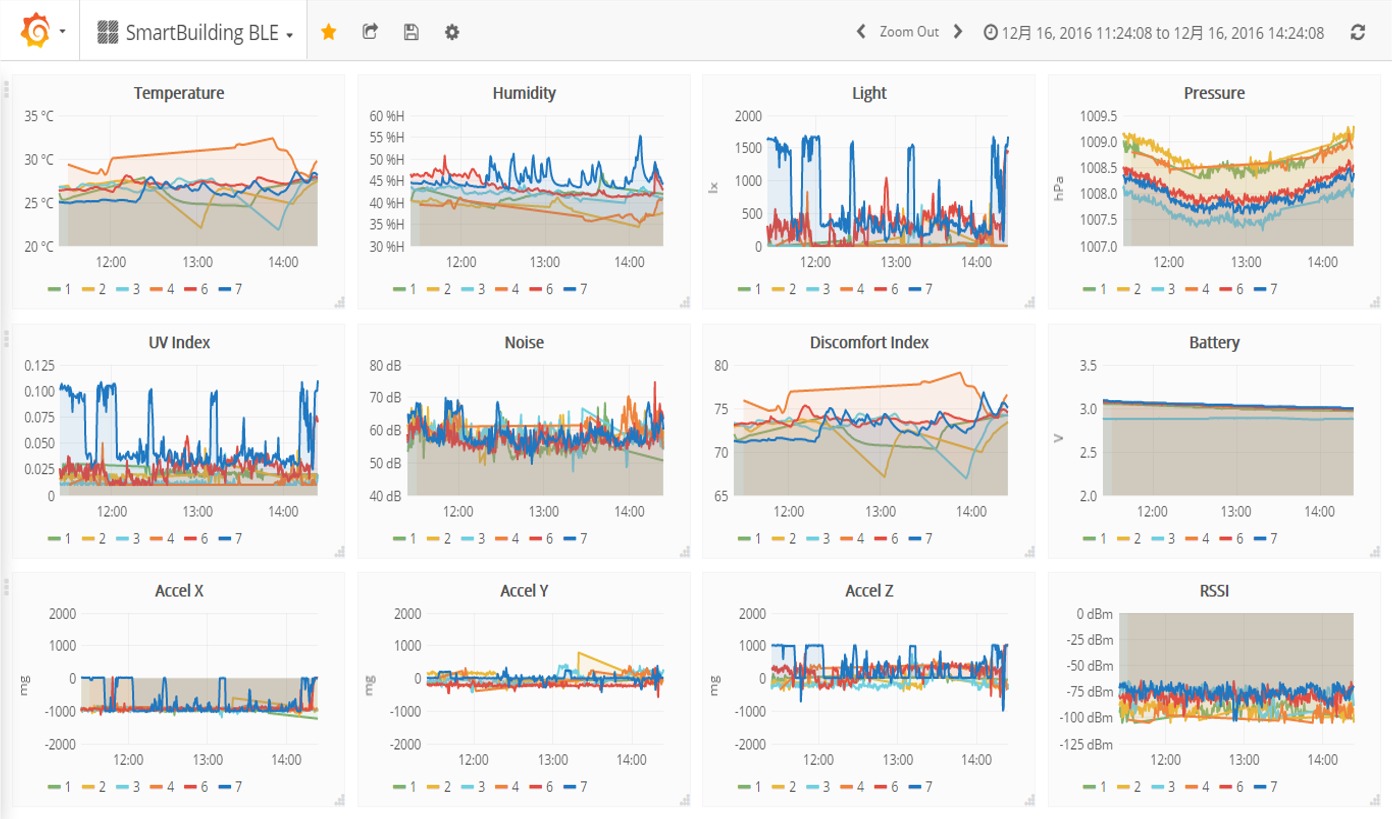
It should be noted that this example code is for demonstration purposes only, it is not intended for use in a production environment, is not guaranteed fit for any purpose.