Sedater is a Sensor-Validation Converter for motion based sensor systems like the Shimmer R2 or Vicon sensors. It converts the ValidationData to a more machine processable format and groups individual session data together.
The tool includes two (somewhat) independent utilities:
- The parser, processor and exporter of Sensor-Validation files, called
sedater - The plotter for SVG-graphics, called
plotter
Sedater imports files or directories which were exported by a Vicon or Shimmer (Foot) Sensorutility. These files are usually hardly processable which this tool tries to solve.
The files or directories provided by commandline are crawled and all available files are indexed for later analysis.
The indexing process includes a dissection of the filename. From which serveral
properties are extracted, like session, exercise and sensor orientation.
Based on these values, corresponding files are paired together (all files
belonging to the same session; left and right foot sensors, etc).
The following data conversion is done by two modules, because the sensors usually export two kinds of files:
- [RawValidation Data](#TextValidation Processing)
- [TextValidation Data](#RawValidation Processing)
TextValidation data is stored in a readable (kind of) CSV file, looking like:
Meta1,Foo,,,,
Meta2,Bar,,,,
Meta3,Baz,,,,
Start,End
1,2
3,4
5,6
These files are imported, analyzed and later exported as well formed XML-files.
RawValidation data is straight from the sensors available as binary files.
These files will be detected based on the .dat filename extension.
Matching binary files are parsed as a stream of six 2B-sized tuples
according to the following pattern:
    Binary File Format
                 1 11
    12 34 56 78 90 12 Bytes
    ,----------------------
    |  |  |  |  |  |  | ...
    `----------------------
     ^  ^  ^  ^  ^  ^
     |  |  |  |  |  `- Gyro Z
     |  |  |  |  `---- Gyro Y
     |  |  |  `------- Gyro X
     |  |  `---------- Accel Z
     |  `------------- Accel Y
     `---------------- Accel X
     With each single datum as uint16 (unsigned short)
        which composes one dataset to an 12B Array
After the import and unpacking of the binaries, the data needs to be normalized.
Each Sensor provides a unique CSV calibration file (provided on commandline), with which the data is normalized by offset calculation.
The now normalized data is later exported as CSV files.
Both - the Raw and Text - data is exported back to the filesystem.
All by sedater exported CSV files are plottable via the matplotlib.
The plotting process has to be manually invoked by the command line
(see Usage).
If an annotation.xml file is provided, the plotter is able to draw the
Gold Standard parameters contained in the file.
Cloning the repository should be enough
The tool has the following python requirements which are easily resolved by executing:
pip install -r requirements.txt
The heaviest dependencies are matplotlib and numpy which are
exclusivly used for the optional plotting of the
Rawvalidation files. The main functionality is given without them.
If you choose to not rely on plotting simply don't install them by
commenting them out in the dependency file
(prefix with: #).
The testcases are automatically running against multiple python versions:
- Python3.5.0
- Python3.4.2
- Python3.3.5
Rendering a green build status is therefore a good indicator that the listed python versions are likely to be working.
Python2.7.10 & Python3.2 are currently not supported.
This might change in the future.
If you have access to /bin/bash (as you do on Linux systems), invoke the
binarys from the bin directory:
./bin/sedater -h
./bin/plotter -h
Consult the help message for command line parameters.
If you are on a Windows system (or don't have access to /bin/bash), run the
main.py respectively:
./sedater/main.py --help
./sedater/plotter/main.py --help
./bin/sedater -r tmp/A6DV.csv -l tmp/A917.csv -c -o tmp/exp/ tmp/ValidationRawData\
    tmp/GoldStandard_GaitRite tmp/GoldStandard_StrideBorders
resulting in:
tmp/exp
└── session2_E4
    ├── annotation.xml
    ├── leftSensorNormalized.csv
    ├── metainformation.xml
    └── rightSensorNormalized.csv
and after plotting:
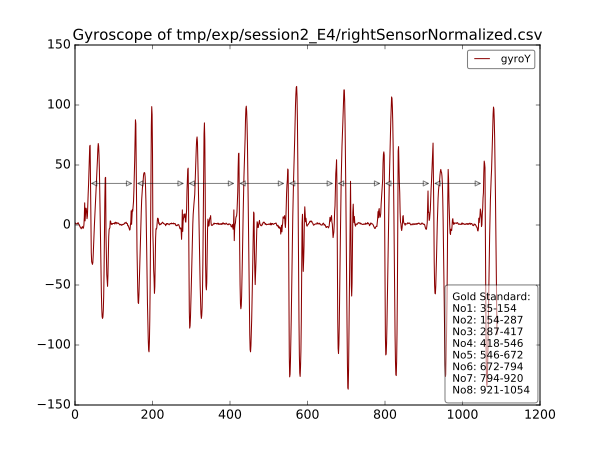
./bin/plotter -c -g gyroY -x tmp/exp/session2_E4/annotation.xml\
    tmp/exp/session2_E4/leftSensorNormalized.csv\
    tmp/exp/session2_E4/rightSensorNormalized.csv
the following image is created:
Further examples are here.
The code is annotated by docstrings, which are automatically parsed by Sphinx and online available at readthedocs.org:
Refer to the Developer documentation for further details
Run nosetests in the code directory (sedater).
All tests are automatically executed by Travis CI on each code update.
Unfortunately lacks the plotter testcases at the moment.
