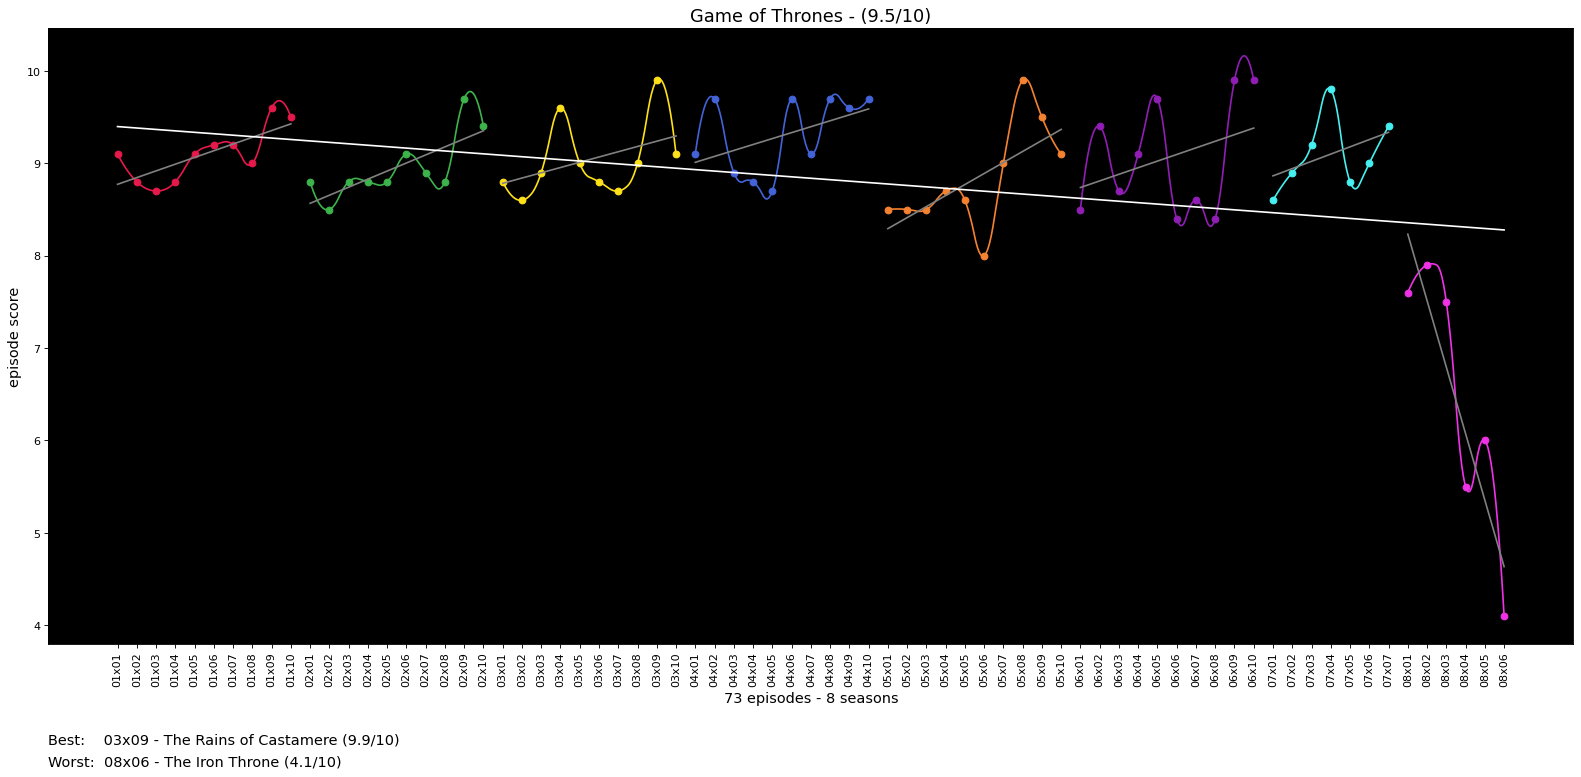
This repo provides insights on visual media like shows and movies. For example, it can create graphs like this:
And comaprisons like this:
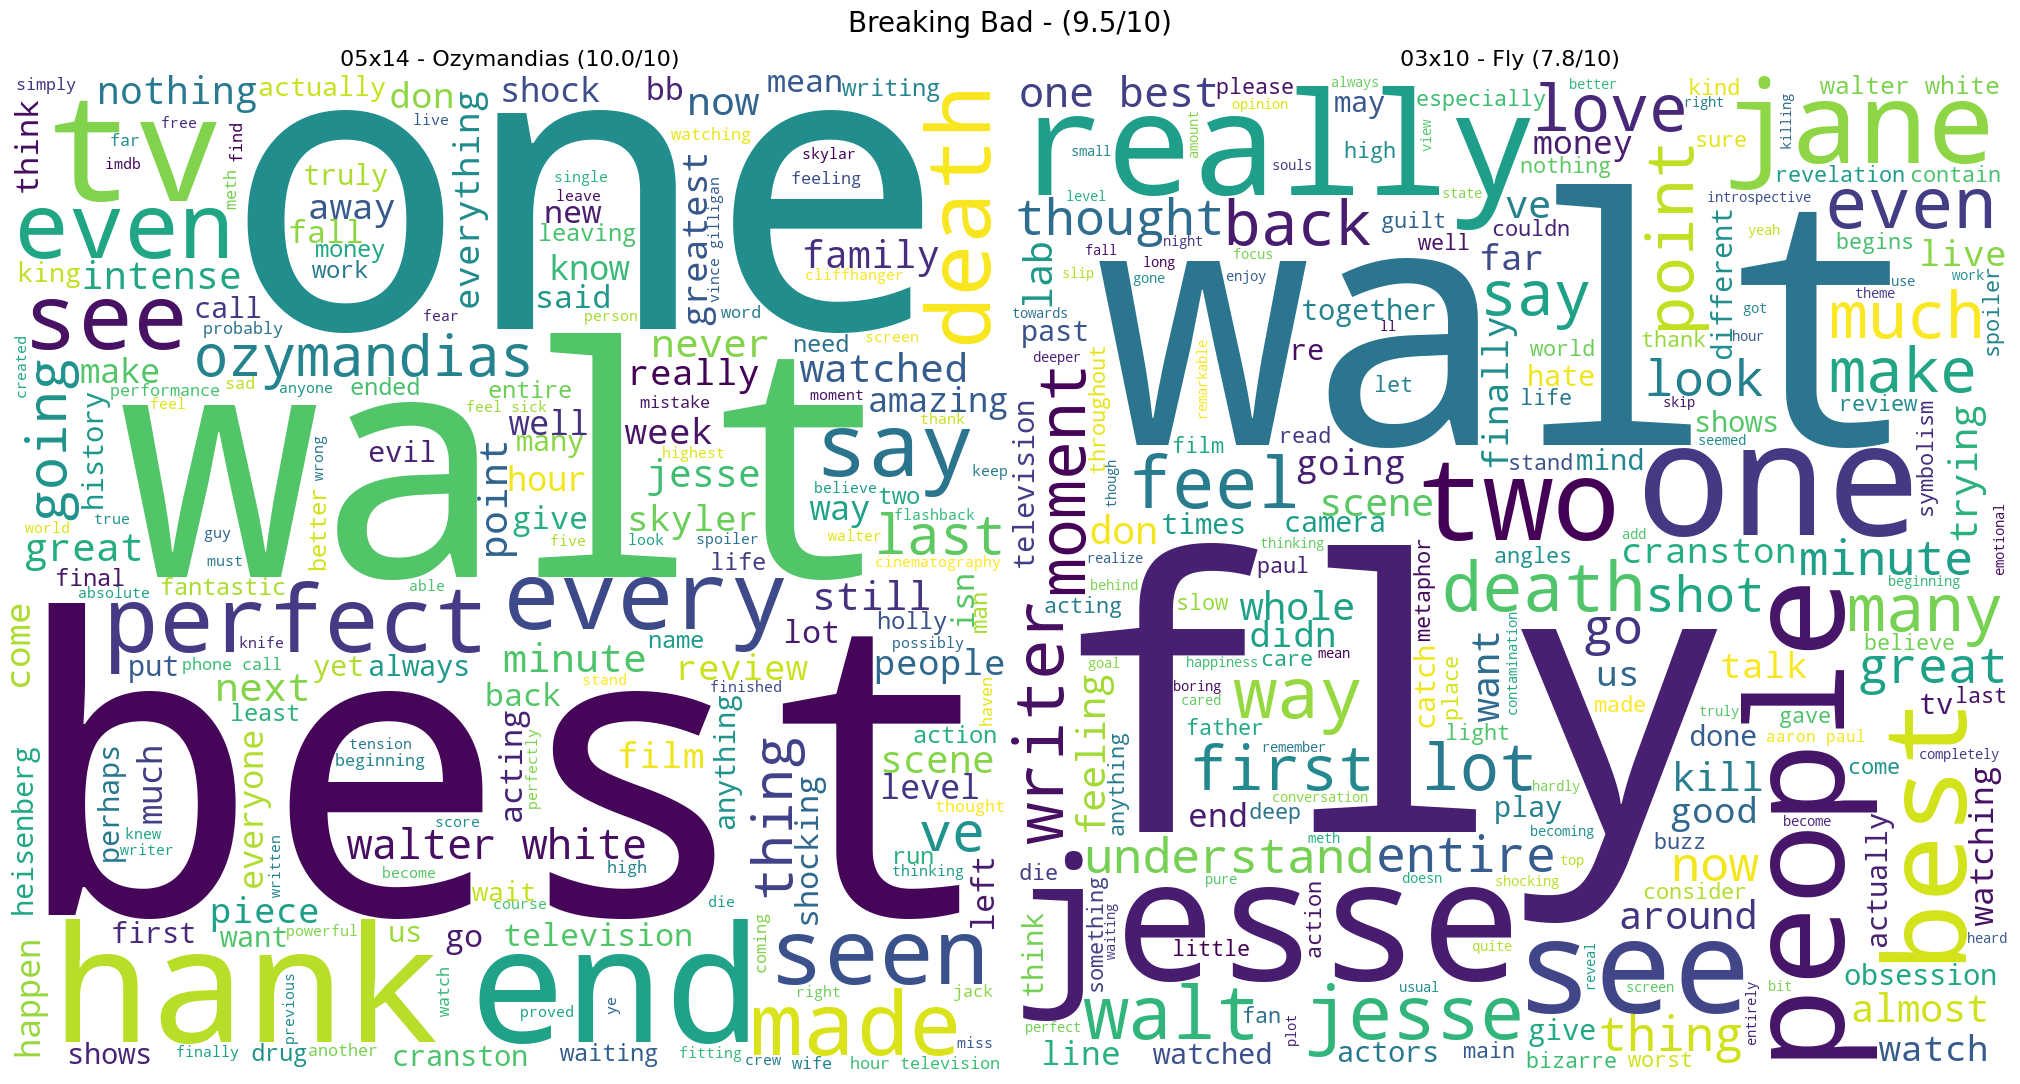
Also it can make word clouds from a show's best and worst episodes IMDB reviews.
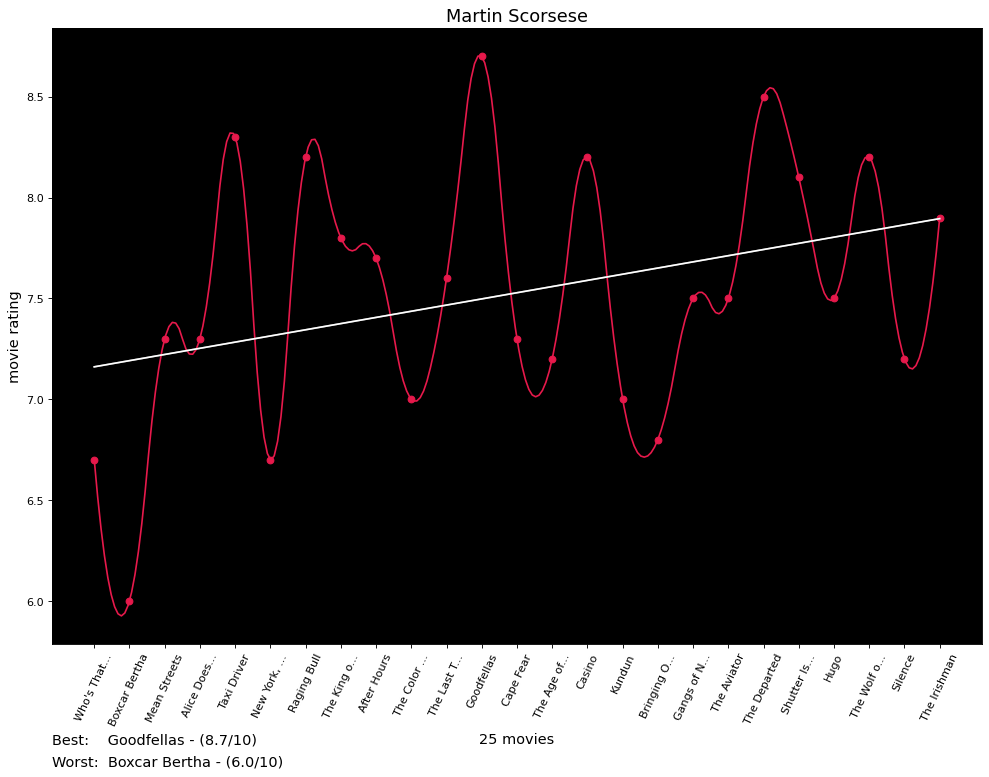
Lastly, it can plot all movies from a particular director's oeuvre.
This repository uses Python 3.7. Ensure you have that installed before starting. Using a virtual environment is not required, but is highly recommended.
If you need to get an API key from OMBD, go here: http://www.omdbapi.com/apikey.aspx
# 1. Clone the repo
git clone <THIS REPO>
cd <THIS REPO>

# 2. Set up virtual environment
python -m venv .venv
source .venv/bin/activate

# 3. Install reqs
python -m pip install -r requirements.txt

# 4. get and export OMDB API Key
# http://www.omdbapi.com/apikey.aspx
export OMDB_API_KEY=<YOUR KEY>

# 5. Start exploring!
python -m vmi.plot.graph "The Wire" Note: all commands must be run from the vmi/ directory.
Note: all output images end up in the output directory.
Creating a graph for a single show
python -m vmi.plot.graph "Show name"

# For example
python -m vmi.plot.graph "The Wire"
Creating a graph for a single season of a show
python -m vmi.plot.graph "Show name" SEASON_NUM

# For example
python -m vmi.plot.graph "The Wire" 1
Creating a graph that compares two shows
python -m vmi.plot.graph "Show name" "Other show name"

# For example
python -m vmi.plot.graph "The Wire" "Breaking Bad"
Creating a graph that compares two seasons of the same show
python -m vmi.plot.graph "Show name" SEASON_NUM SEASON_NUM

# For example
python -m vmi.plot.graph "The Wire" 1 2
Creating a graph that compares two seasons of differnt shows
python -m vmi.plot.graph "Show name" SEASON_NUM "Other show name" SEASON_NUM

# For example
python -m vmi.plot.graph "The Wire" 1 "Breaking Bad" 1This feature creates word clouds from the reviews for the best and worst episodes of a particular show or season.
Creating a word cloud for a single show
python -m vmi.plot.cloud "Show name"

# For example
python -m vmi.plot.cloud "The Wire"
Creating a word cloud for a single show
python -m vmi.plot.cloud "Show name" SEASON_NUM

# For example
python -m vmi.plot.cloud "The Wire" 1Viewing insights for a show
python -m vmi.insights.show "Show name"

# For example
python -m vmi.insights.show "The Wire"Viewing insights for a particular director
python -m vmi.plot.director "director IMDB id"

# For example
python -m vmi.plot.director nm0000217Run the tests
python -m pytest


