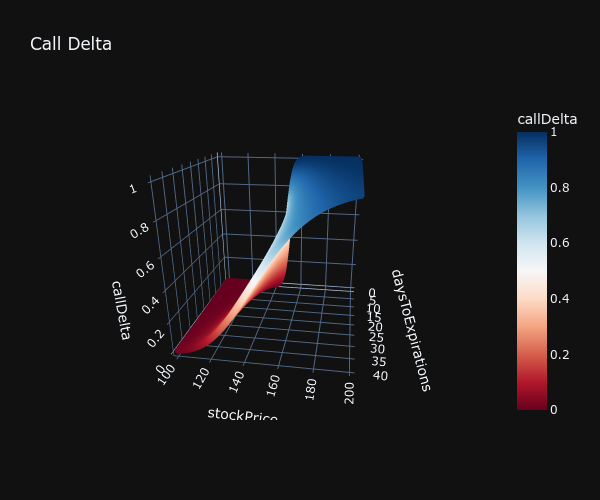
Some pleasing customizable 3d plots in Jupyter.
This notebook will allow 3d plotting of greeks over a range of underlying prices and days to maturity. The plots are three dimensional interactive with pop ups. Here is an example.
You can just run the cells in the notebook at their default settings to start.
The get_all_greeks function will create a dataframe with all the greeks calculated over a
2D array of prices and time to maturity. Here are the parameters and defaults.
stock_low : float
    Lowest underlying price in the price range.
stock_high : float
    Highest underlying price in the price range.
strike : float
    Strike price of the option.
stock_increments : float
    This is the increments in the price range. A lower increment results in
    more price points and a better graph, but longer compute time.
max_days : int
    Number of days away from maturity to consider.
"""

stock_low=100
stock_high=200
strike =150
stock_increments = .25
max_days=40
To select a plot to display, use the index numbers below. 1 - Put Price 2 - Call Delta 3 - Put Delta 4 - Call Delta 2 5 - Put Delta 2 6 - Call Theta 7 - Put Theta 8 - Call Rho 9 - Put Rho 10 - Vega 11 - Gamma
Install using the requirements.txt document.
pip freeze > requirements.txt
Alteranatively add the following packages using pip.
- pandas
- scipy
- mibian
- plotly
- dash
- jupyter-dash
- nbformat
