Due: Oct 18, 2021 by 11:59pm ET
See the queries for more indepth discussions
-
Which bus stop has the largest population within 800 meters? As a rough estimation, consider any block group that intersects the buffer as being part of the 800 meter buffer.
stop_name estimated_pop_800m the_geom Passyunk Av & 15th St 50,867 Point -
Which bus stop has the smallest population within 800 meters?
stop_name estimated_pop_800m the_geom Charter Rd & Norcom Rd 2 Point -
Using the Philadelphia Water Department Stormwater Billing Parcels dataset, pair each parcel with its closest bus stop. The final result should give the parcel address, bus stop name, and distance apart in meters. Order by distance (largest on top).
# address stop_name distance_m 1 1431 W SOMERSET ST Broad St & Somerset St 77.09 2 1437 W SOMERSET ST Broad St & Somerset St 91.72 3 9101 FRANKFORD AVE Frankford Av & Tolbut St 144.85 4 193 W WINGOHOCKING ST Wingohocking St & Rising Sun Av 63.58 5 186 W ANNSBURY ST Wingohocking St & Rising Sun Av 80.13 -
Using the shapes.txt file from GTFS bus feed, find the two routes with the longest trips. In the final query, give the
trip_headsignthat corresponds to theshape_idof this route and the length of the trip.trip_headsign trip_length Bucks County Community College 46,504 Oxford Valley Mall 43,658 -
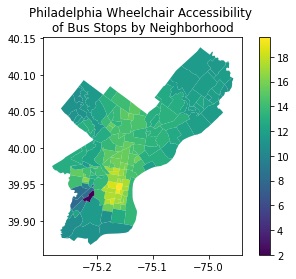
Rate neighborhoods by their bus stop accessibility for wheelchairs. Use Azavea's neighborhood dataset from OpenDataPhilly along with an appropriate dataset from the Septa GTFS bus feed. Use the GTFS documentation for help. Use some creativity in the metric you devise in rating neighborhoods. Describe your accessibility metric:
PROCESS To rate neighborhoods by their bus stop accessibility for wheelchairs, I formed an accessibility metric that aggregated point ratings of three metrics:
- Percent of Accessible Bus Stops where wheelchair boardings were possible (out of 10 points) (from the GTFS Google Bus Stops dataset of Philadelphia)
- Bus Stops per square mile (out of 5) (area & aggregate based on OpenPhillyData's Neighborhood polygons)
- Average Accessible Bus Stops per Square Mile of the neighboring neighborhood (out of 5)
The three metrics rate the accessibility of immediate bus stops and the transit system at large. However, only on a surface level and there is a bias towards higher density areas (without considering the networks of the bus lines, transit system, and walking paths). See my query for a in-depth discussion
-
What are the top five neighborhoods according to your accessibility metric?
accessibility_rank neighborhood_name accessibility_metric num_bus_stops_accessible num_bus_stops_inaccessible 1 Washington Square West 19.58 72 2 2 Hawthorne 19.18 30 0 3 Rittenhouse 18.54 99 4 4 Newbold 18.36 45 4 5 Bella Vista 18.09 25 0 -
What are the bottom five neighborhoods according to your accessibility metric?
rank neighborhood_name accessibility_metric num_bus_stops_accessible num_bus_stops_inaccessible 157 Bartram Village 1.99 0 14 156 Paschall 7.98 32 38 155 Woodland Terrace 8.08 2 8 154 Southwest Schuylkill 8.27 23 29 153 Kingsessing 8.64 37 32 -
With a query, find out how many census block groups Penn's main campus fully contains. Discuss which dataset you chose for defining Penn's campus.
upenn_count_block_groups 36 I used OpenDataPhilly's college & university dataset (which is just the Parcel dataset with labels). See my query for a in-depth discussion
-
With a query involving PWD parcels and census block groups, find the
geo_idof the block group that contains Meyerson Hall. ST_MakePoint() and functions like that are not allowed.geo_id 421010369001 -
You're tasked with giving more contextual information to rail stops to fill the
stop_descfield in a GTFS feed. Using any of the data sets above, PostGIS functions (e.g.,ST_Distance,ST_Azimuth, etc.), and PostgreSQL string functions, build a description (alias asstop_desc) for each stop. Feel free to supplement with other datasets (must provide link to data used so it's reproducible), and other methods of describing the relationships. PostgreSQL'sCASEstatements may be helpful for some operations.stop_id stop_name stop_desc stop_lon stop_lat 90221 Manayunk Located at 4401 Cresson St -75.225 40.0269444 90314 49th Street Located at 1100 S 49th St -75.2166667 39.9436111 90320 Forest Hills Located at 299 Byberry Rd -75.0205556 40.1277778 90321 Somerton Located at 14021 Bustleton Ave -75.0119444 40.1305556 90401 Airport Terminal E F Located at 8500 Essington Ave -75.2397222 39.8794444

like any public project, I sacrificed creativity in order to finish at the last second