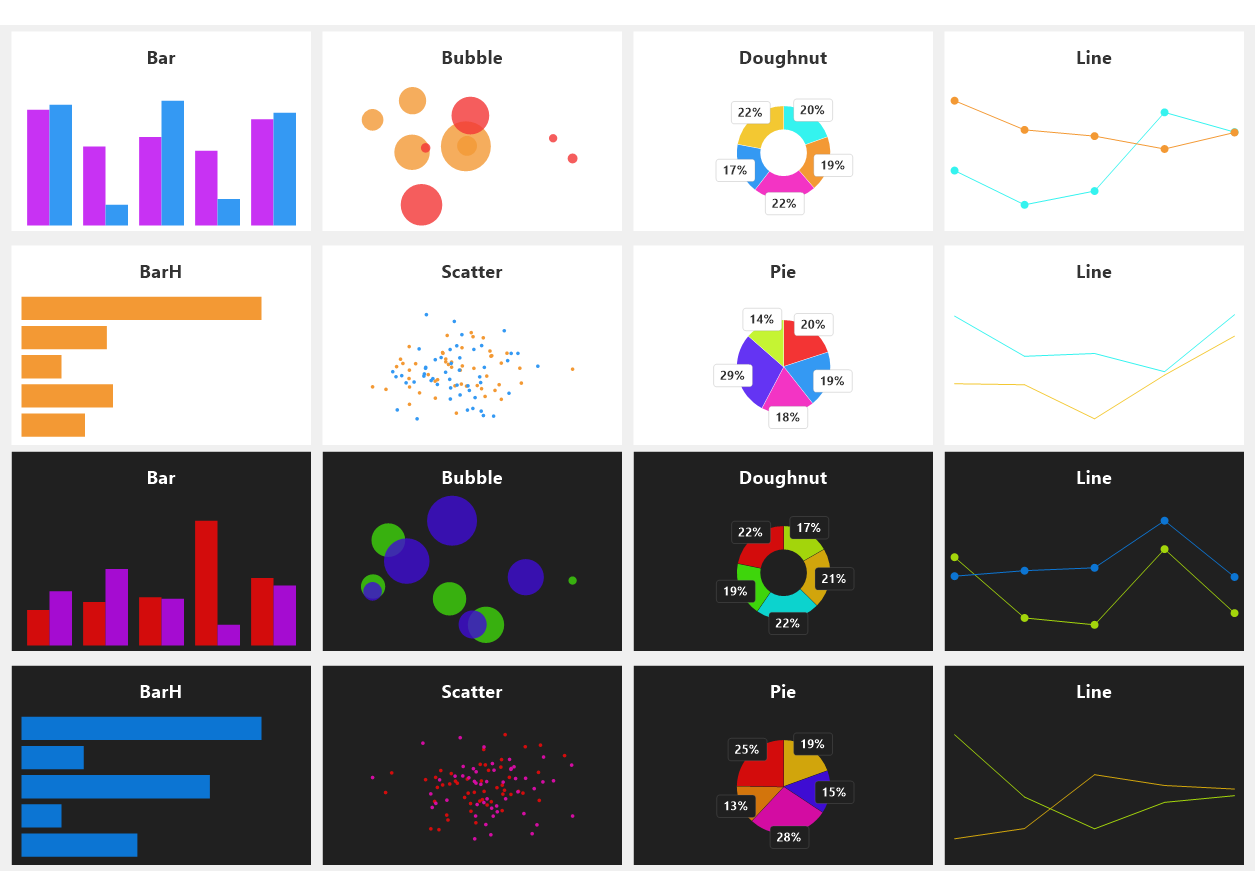
오토핫키용 차트 라이브러리입니다. 테마기능을 지원하고 모든 텍스트 레이블은 반응형으로 문자열 길이에 맞게 사이즈조절이 되도록 구현했습니다.
내부 코드는 global 및 클래스와 같은 super-global변수의 중복을 방지하기 위해 chart함수와 Charter클래스에서만 구현되어 글로벌 네이밍에 영향을 최소로 하였습니다.
현재 테스트 및 개발중인 버전으로 사용시 많은 피드백 및 기여 부탁드립니다.
Gdip_All 라이브러리는 포함되어 있습니다.
아래 두가지 방법중 하나를 선택하여 설치하세요. 먼저 git이 설치되어 있어야 합니다.
RunWait % comspec " /c " git clone https://github.com/neovis22/chart.git", % a_ahkPath "\..\Lib"RunWait % comspec " /c " git clone https://github.com/neovis22/chart.git Lib/chart"사용할 스크립트에 아래 코드를 추가하세요.
#Include <chart/chart>
#include <chart/gdip_all>

OnExit(Func("Gdip_Shutdown").bind(Gdip_Startup())) ; Gdip 시작 및 종료시 해제Gui Add, Text, xm w300 h200 0xE Hwndhwnd
chart := chart(hwnd)
chart.data([40, 20, 50, 30])
chart.plot()
Gui Show모든 함수는 체인구조로 사용이 가능하며 위 코드 아래 코드와 동일하게 작동합니다.
Gui Add, Text, xm w300 h200 0xE Hwndhwnd
chart := chart(hwnd).data([40, 20, 50, 30]).plot()
Gui Show차트에 데이터를 추가하는 방법은 datasets에 직접 추가하거나 data() 함수를 이용하여 추가할 수 있습니다. 아래 두줄의 코드는 동일하게 작동합니다.
; 함수로 추가
chart.data([20, 30, 40], {label:"데이터"})

; 데이터배열에 직접 추가
chart.datasets.push({data:[20, 30, 40], label:"데이터"})
모든 데이터를 지우고 싶다면 빈 배열로 초기화 할 수 있습니다.
chart.datasets := []데이터가 값이 아닌 객체일 경우 키를 지정합니다. 키를 지정하지 않을경우 스케터, 버블차트는 xKey = 1, yKey = 2, rKey = 3으로 배열로써 값을 판단하고 그 외의 차트는 키를 생략시 값 자체를 값으로 판단합니다. 다차원 객체의 속성은 .으로 분리된 문자열로 지정할 수 있습니다. {xKey:"order.date", yKey:"order.total"}
data := []
data.push({quantity:14})
data.push({quantity:22})
data.push({quantity:8})

chart.data(data, {yKey:"quantity"}); 함수 사용
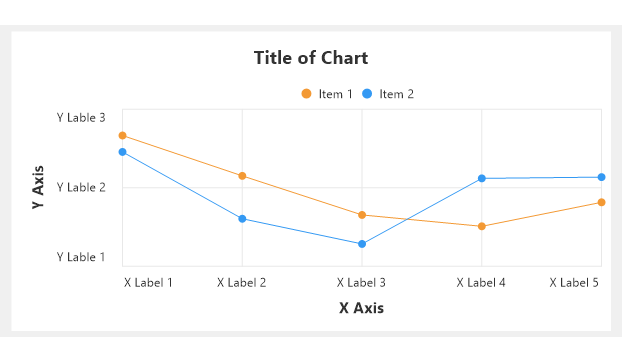
chart.title("차트 제목")
chart.xAxis.title("X축 제목")
chart.yAxis.title("Y축 제목")
; 속성 사용
chart.title.text := "차트 제목"
chart.xAxis.title.text := "X축 제목"
chart.yAxis.title.text := "Y축 제목"chart.labels("문자열은,콤마로,구분합니다")
chart.xAxis.labels("입력된,수,만큼,표시됩니다")
chart.yAxis.labels(["배열","역시","가능해요"])title과 label은 TextRenderer로 생성한 객체이므로 color, font, fontSize, align 등의 텍스트 설정을 사용할 수 있습니다.
각 축의 레이블은 커스텀 함수 혹은 Format함수에서 사용하는 포맷으로 변환이 가능합니다.
chart.yAxis.format := "{:.2f}" ; 0.283572 -> 0.28chart.yAxis.formatter := "formatHHMM" ; 함수의 이름 혹은 함수의 객체
formatHHMM(datetime) { ; 20220610161203 -> 16:12
FormatTime time, % datetime, HH:mm
return time
}chart.plot()데이터 입력과 설정을 마치고 plot() 혹은 render()를 호출하여 차트를 출력합니다.
스태틱컨트롤에 차트를 출력할 뿐 아니라 이미지에 직접 그릴 수 있도록 render() 함수를 제공합니다. 렌더링 대상으로 비트맵의 그래픽스 포인터를 인수로 전달하여 차트를 출력할 수 있습니다.
렌더링하기 전 width, height를 필수로 지정해야 합니다.
파일로 저장하는 함수는 기본으로 제공되고있습니다.
chart.save("chart.png", 300, 200)직접 저장
chart.width := 300
chart.height := 200

; 비트맵 생성
pbm := Gdip_CreateBitmap(chart.width, chart.height)
pg := Gdip_GraphicsFromImage(pbm)

; 차트 렌더링
chart.render(pg)

; 파일로 저장
Gdip_SaveBitmapToFile(pbm, "chart.png")

Gdip_DeleteGraphics(pg)
Gdip_DisposeImage(pbm)데이터가 변경되어 갱신해야 할 때 원본 데이터객체에 변경사항이 반영된다면 plot()함수를 호출하여 바로 업데이트할 수 있습니다. 만약 새로 생성된 객체라면 생성된 순서에 해당하는 데이터셋의 data속성으로 덮어쓰기 해야합니다. chart.datasets[index].data := data
Gui Add, Pic, xm w400 h200 0xE Hwndhwnd
Gui Add, Button, gUpdate, Update
Gui Show
chart := chart(hwnd)
chart.data(data := [])

Update:
loop 5 {
    Random n, 0, 100
    data[a_index] := n
}
chart.plot()
return다양한 스타일로 변경 및 사용편의를 위해 테마기능을 지원합니다. 기본 테마로 light와 dark 테마를 지원하며 커스텀 테마의 추가 및 수정을 할 수 있습니다.
Charter.themes객체에 테마명을 속성으로 커스텀 테마를 추가, 수정 및 제거할 수 있습니다. 색상뿐만 아니라 border, padding, title 등 모든 속성을 테마로 미리 지정할 수 있습니다.
하위객체에 접근하기 위해서는 .으로 연결되는 "xAxis.title"과 같은 키로 지정합니다.
Charter.themes.MyTheme := {
(join ltrim
    palette: [0xF33434, 0xC5F433, 0xF39934, 0x6434F3, 0x3499F3, 0xF334C4, 0xF3C832, 0x34F3EF, 0x64F433, 0xC832F3],
    backgroundColor: 0xFFFFFF,
    borderColor: 0xE2E2E2,
    gridColor: 0xE8E8E8,
    color: 0x333333,
    font: "Consolas",
    "xAxis.title.paddingTop": 20,
    "yAxis.title.paddingRight": 20
)}chart.theme("MyTheme")테마의 적용은 모든 속성이 현재 차트로 덮어쓰기되어 적용됩니다.
Bar는 BarV와 동일하며 BarH는 가로로 표시됩니다. 가장 기본적인 차트로 일차원 배열 혹은 다차원 배열에서 yKey에 지정한 속성의 값으로 출력합니다.
Line차트는 Bar차트와 기본적으로 동일하며 라인의 두께를 width로 설정 및 포인트 원의 반지름을 radius속성으로 설정할 수 있습니다.
chart.data(data, {radius:5, width:2})Scatter차트는 x, y의 값으로 표시하여 분포도를 확인하는 차트입니다. Line차트와 마찬가지로 radius를 설정할 수 있습니다. xKey와 yKey로 속성을 직접 지정할 수 있으며 생략시 2차원 배열로 판단하여 [x, y]의 데이터로 표시합니다.
Bubble차트는 Scatter차트에서 원의 크기가 추가된 차트입니다. 2차원배열의 3번쨰 인수 혹은 rKey로 지정한 속성의 값으로 크기를 결정하게 됩니다.
Pie와 Doughnut차트는 데이터마다 레이블을 지정해야 합니다. labels속성에 콤마로 구분된 문자열 혹은 배열을 설정합니다. 데이터별 색상은 colors속성에 색상 배열로 지정할 수 있으며 생략시 차트 팔레트에서 가져옵니다.
; 데이터별 레이블 지정방법
chart.data(data, {labels:"첫번째,두번째,세번째"})

; 데이터별 색상지정
chart.data(data, {colors:[0xFF0000, 0xFF00, 0xFF]})chart := chart([hwnd], type="bar")hwnd렌더링 대상인Static컨트롤의 핸들type"Bar" | "BarH" | "BarV" | "Line" | "Pie" | "Doughnut" | "Scatter" | "Bubble"
chart.data(data, options: Dataset)chart.grid([xCount], [yCount])chart.theme(theme, paletteShuffle=false)chart.shufflePalette()chart.plot()chart.type(type)chart.render(pGraphics)pGraphics비트맵의 그래픽스 포인터
chart.save(path, [width], [height], [quality=100])chart.titleTextRendererchart.typechart.xAxisAxischart.yAxisAxischart.datasets[Dataset, ..]chart.palette[rgb | argb, ..]chart.fontchart.colorrgb | argbchart.backgroundColorrgb | argbchart.gridColorrgb | argbchart.bar.width
dataset.dataarraydataset.colorrgb | argbdataset.colors[rgb | argb, ..]파이와 도넛을 위한 컬러배열dataset.labeldataset.labelsarray | commaSeperatedStringdataset.xKeydataset.yKeydataset.rKeydataset.radius
axis.range([min], [max])axis.grid([count], [width], [color])axis.labels(label*)axis.format(format)axis.formatter(formatter)formatterfunction(label)
axis.titleTextRendereraxis.labelTextRendereraxis.gridWidthaxis.gridColoraxis.gridCountaxis.labelsarray | commaSeperatedStringaxis.formataxis.formatterfunction(label)axis.minaxis.max
tr.texttr.colorrgb | argbtr.fonttr.fontSizetr.options"c" rgb | "c" argb"s" fontSize"Left""Center""Right""Top""Middle""vCenter""Bottom""Regular""Bold""Italic""Underline""Strikeout""NoWrap"
tr.align0 | 1 | 2 | "Left" | "Center" | "Right"tr.lineAlign0 | 1 | 2 | "Left" | "Center" | "Right"
box.margin(n)box.margin(height, width)box.margin(top, width, bottom)box.margin(top, right, bottom, left)box.border(n)box.border(height, width)box.border(top, width, bottom)box.border(top, right, bottom, left)box.padding(n)box.padding(height, width)box.padding(top, width, bottom)box.padding(top, right, bottom, left)box.xbox.ybox.widthbox.heightbox.rect{x, y, width, height}box.contentRect{x, y, width, height}box.topbox.rightbox.bottombox.leftbox.marginTopbox.marginRightbox.marginBottombox.marginLeftbox.borderColorrgb | argbbox.borderTopbox.borderRightbox.borderBottombox.borderLeftbox.paddingTopbox.paddingRightbox.paddingBottombox.paddingLeft


