Welcome to the NetBeez Network Status Dashboard! This public dashboard enables you to share select NetBeez monitoring data with colleagues or customers without having to generate separate reports or create additional NetBeez user accounts.
The dashboard displays current status and open alerts for agents and targets, availability and speed test data for agents, and HTTP response time data for targets. It is a self-contained PHP site that utilizes our new public API and D3 data visualizations.
- An operational NetBeez instance (If you don't have one, please inquire at https://resources.netbeez.net/get-started/schedule-a-demo)
- PHP 7.0 and above and a recent version of Apache 2
- cURL Library enabled
- Make sure PHP and Apache are running on your server and that the cURL library extension for PHP is enabled.
- Download and unzip the public-dashboard repository.
- Go to your NetBeez instance, open Settings > API Keys and generate a new API key (if you have not done so already). Here's more info on API keys.
- Copy
config.sample.phptoconfig.php. - Open
config.phpand enter your information:
- Replace the corny defaults with your real company/organization name and description (these appear on the main page):
//Company/organization name (used for the site title)
define("COMPANY_NAME", "Acme Company");

//Site description (keep it short!)
define("SITE_DESCRIPTION", "This description is declared in the config file!");- If your dashboard is not in a root directory, add the site URL:
//The URL of this site
define("SITE_URL", "/");- Input your NetBeez instance hostname and API key, overwriting the placeholder values:
//The host address of the NetBeez API (this is usually your NB dashboard's hostname)
define("API_HOST", "https://<YOUR_NETBEEZ_SERVER_HOSTNAME>");

//The NetBeez API version
define("API_VERSION", "v1");

//Your authentication key for accessing the API
define("API_AUTH_KEY", "XXXXXXXXXXXXXXXXXXXXXXXXXXXXXXXXXXXXXXXX");
Note: At this point in time, your API version is always going to be v1, so don’t worry about this option.
5. Upload the public-dashboard files to the desired directory on your server/webhost.
6. Visit your new network status dashboard.
In the config file, you’ll see two additional options:
//Boolean setting for cURL option to verify the SSL host
define("SSL_VERIFY_HOST", true);

//Boolean setting for cURL option to verify the SSL peer.
//Default is false due to issue with certificate configuration on internal NetBeez instances
define("SSL_VERIFY_PEER", false);
If you encounter cURL certificate errors, you may need to have both of these options set to false. This is a certificate issue in internally hosted NetBeez instances that prevents access to the endpoint data. If your server/certificate configuration allows, we recommend setting SSL_VERIFY_PEER to true, as this is more secure.
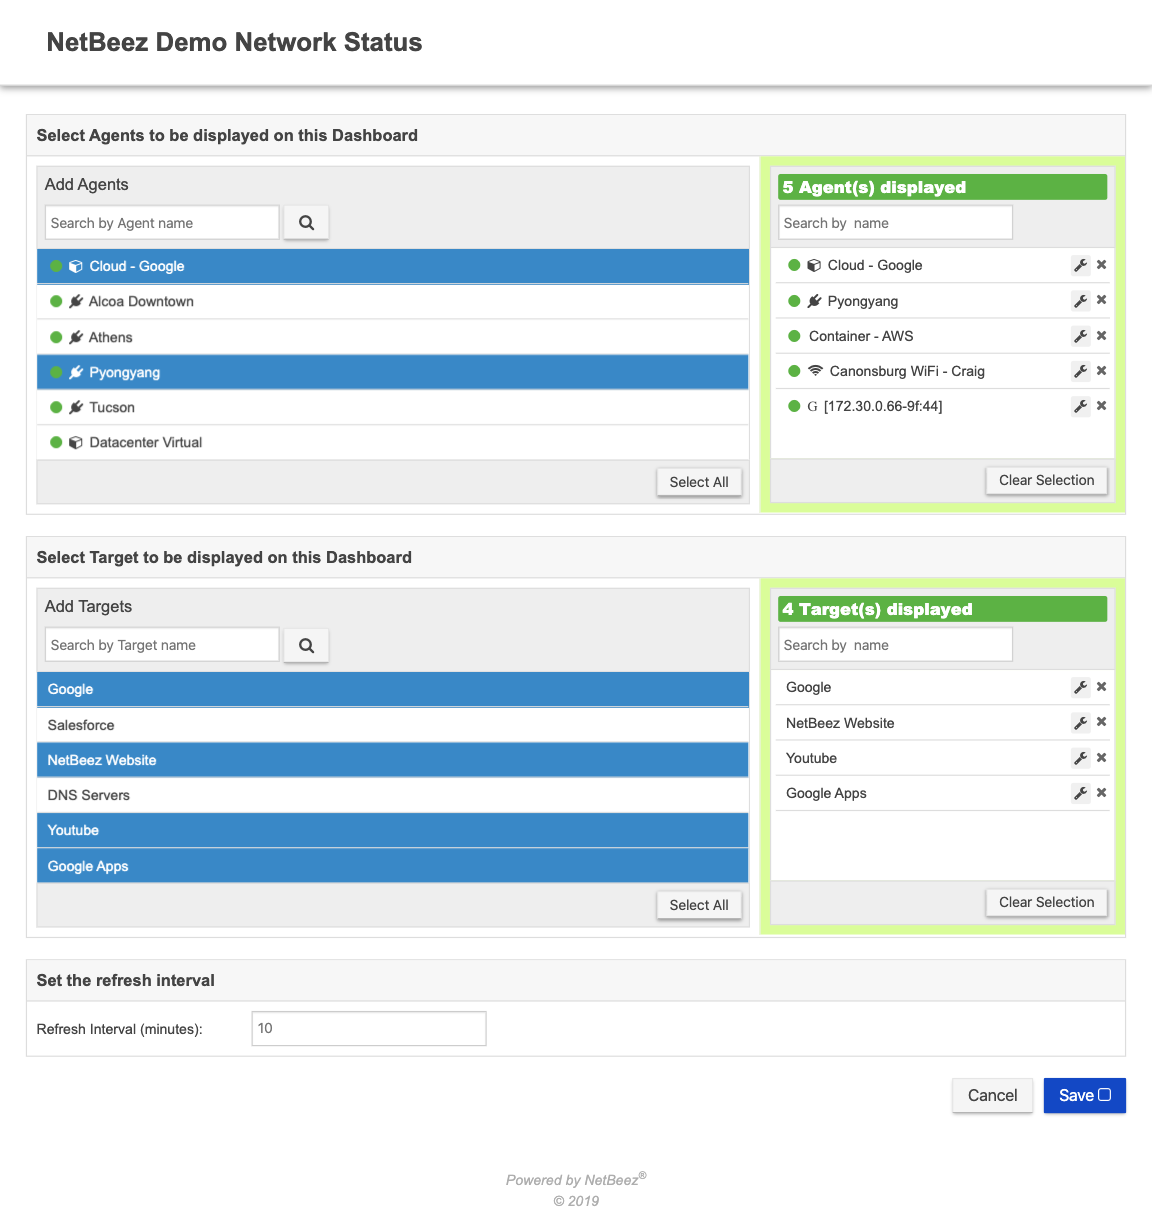
You can access the admin panel using the /admin relative url. This page allows you to select which agents and which targets you want displayed on your public dashboard. You'll have to secure this page by yourself depending on the type of server you are using (e.g. for Apache you'd use .htaccess or something similar).
We’re releasing this dashboard with basic information and styling. Feel free to fork it and customize it to match your own styling and branding. We also encourage you add new data points - this dashboard (as of yet) only utilizes a fraction of the available endpoints in the API. You can find more documentation and more information on your instance's end-point at https://< YOUR_NETBEEZ_HOSTNAME >/swagger/
The NetBeez Network Status Dashboard is available under the Apache License
