This tool connects to Navkio Backup & Replication API endpoints, and fetches licensing and backup information in order to present this data as prometheus metrics that can be pulled via a /metrics endpoint.
This project has been tested on Nakivo Backup & Replication v9 and v10.
It runs on most Linux flavors that have Python 3.6+, and can even run on Windows.
So far, Nakivo requires you to have an enterprise plus license to be able to use the API.
Requires python-pip for setup via dnf install python3-pip or apt-get install python3-pip
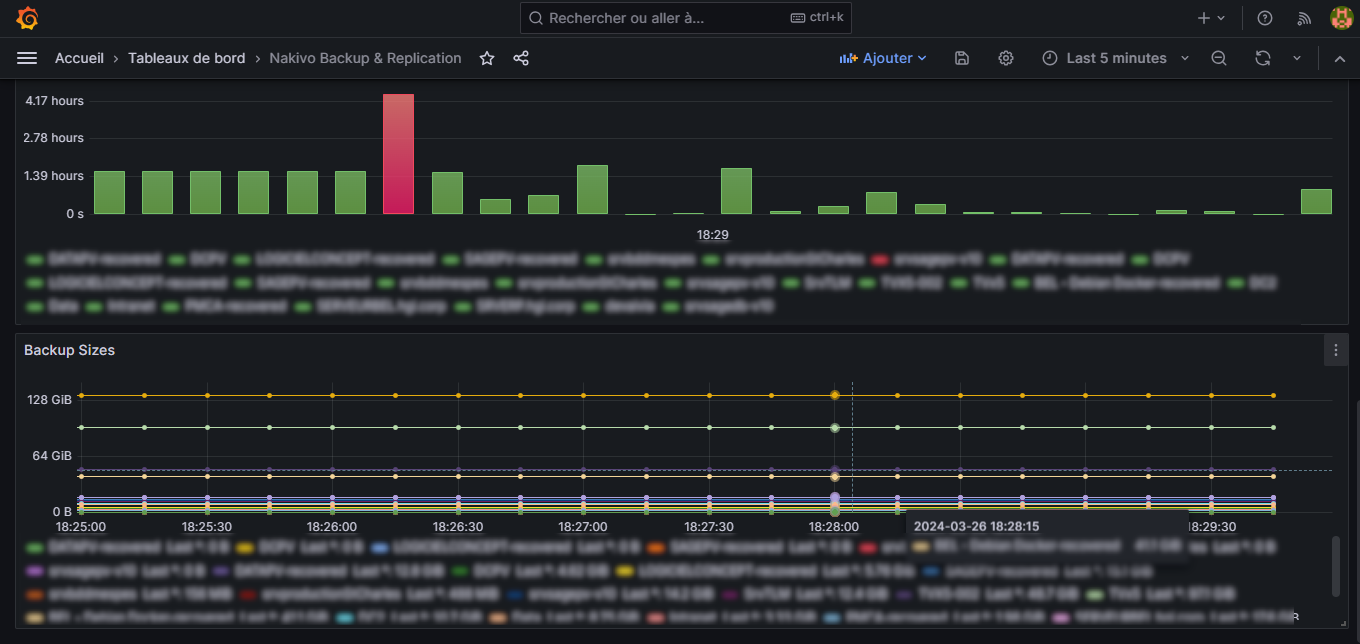
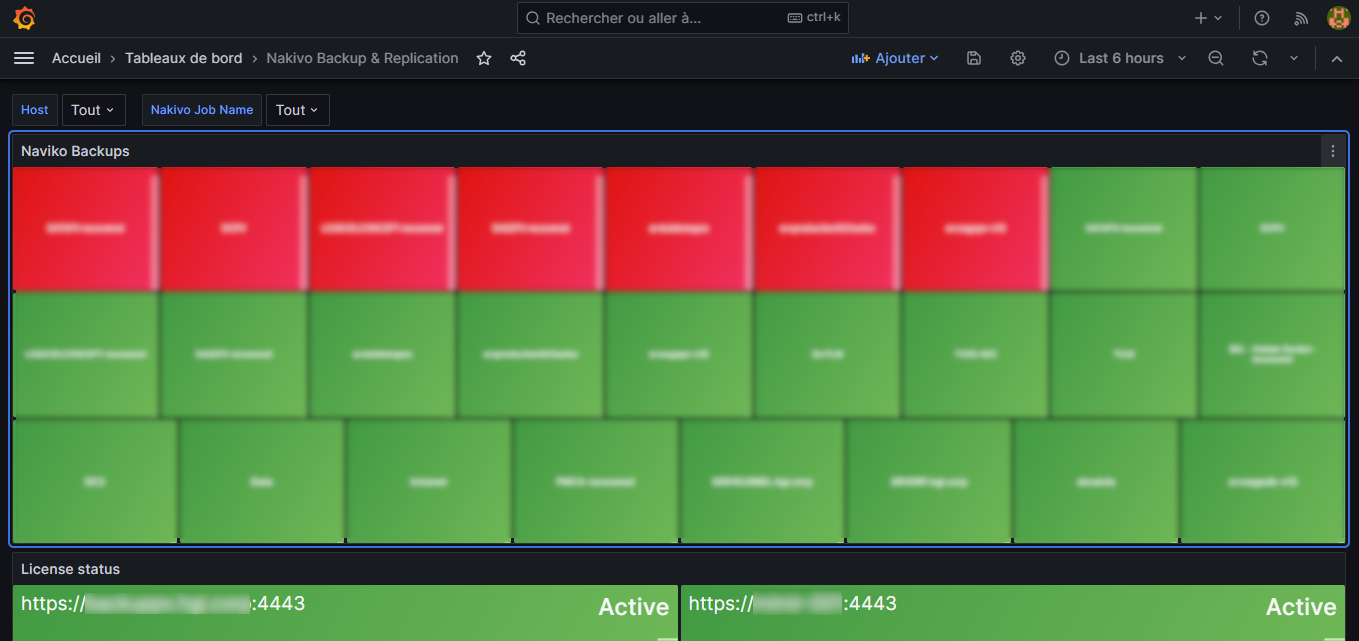
The exporter comes with a basic Grafana Dashboard, showing:
- Licensing status
- Backup states for objects of per job
- Backup sizes
- Backup durations
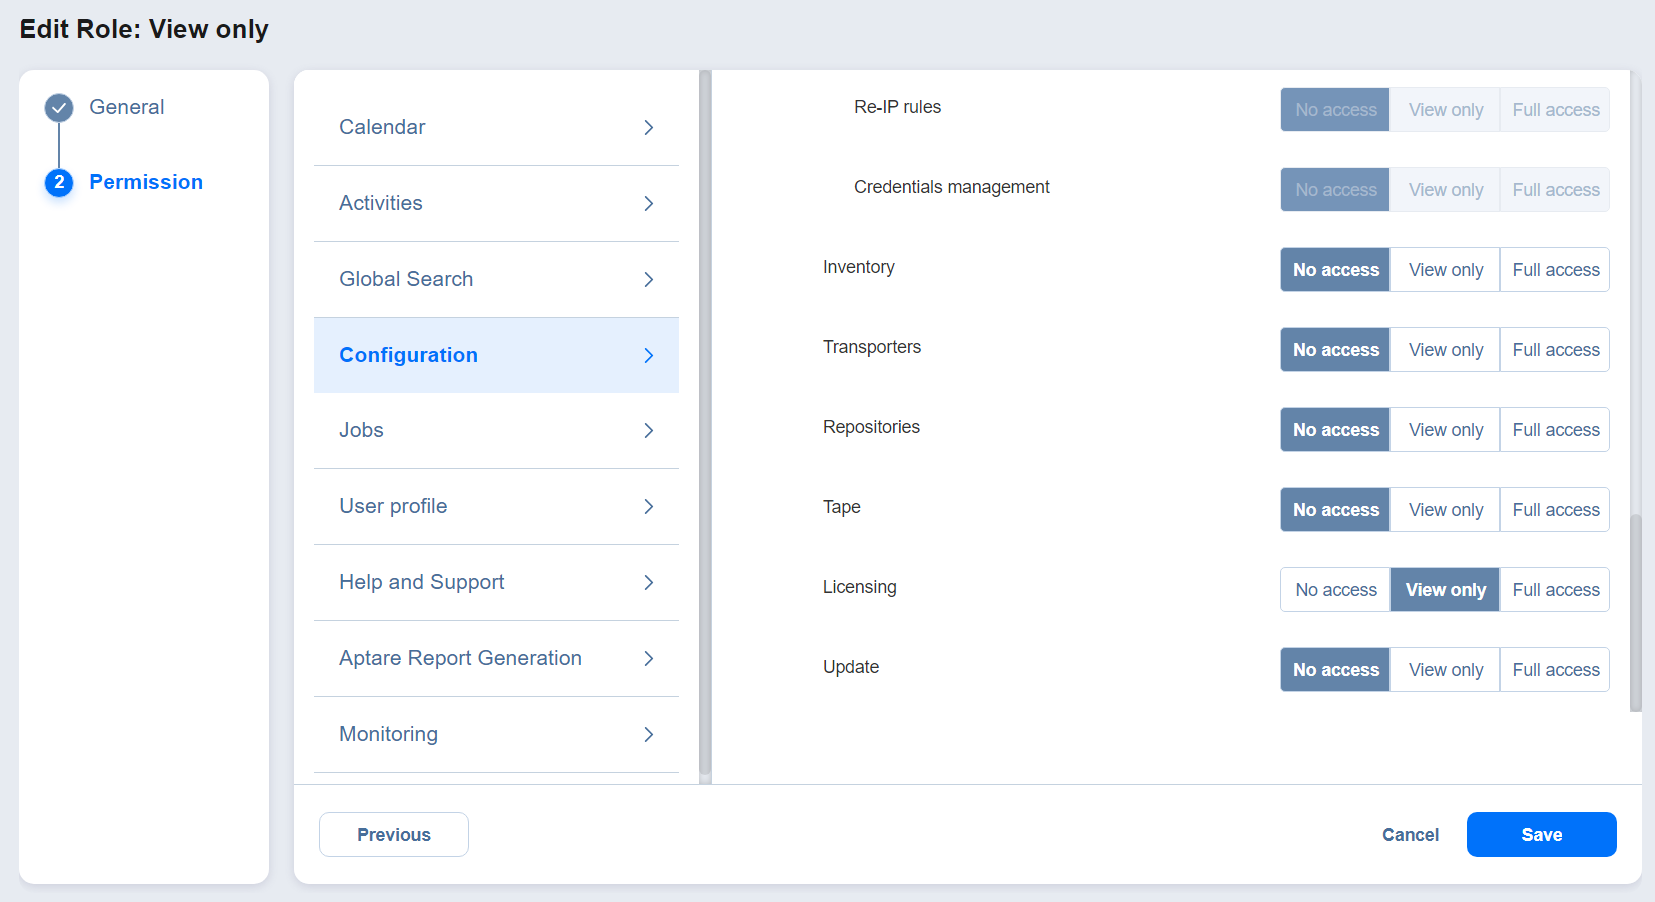
Create a readonly API user with View only role so your exporter doesn't have more rights than it should.
 Also, you may want to modifiy the
 View Only role to add licensing view permissions in Permission > Configuation > Licensing > View only

Grab yourself a copy of nakivo_prometheus_exporter by running
python3 pip install nakivo_prometheus_exporter
Create your YAML config file in let's say /etc/nakivo_prometheus_exporter.yaml
http_server:
  listen: 0.0.0.0
  port: 9119
  username: me
  password: MySecret!Password
  # We usually don't authenticate for prometheus exporters
  no_auth: true
  log_file: /var/log/nakivo_prometheus_exporter.log
nakivo_hosts:
  - MyNakivoHost:
    host: https://mynakivohost.tld:4443
    username: readonly
    password: SomeNicePassword
    cert_verify: False
  - AnotherNakivoHost:
    host: https://othernakivo.local:4443
    username: readonly
    password: OtherPasswrod
    cert_verify: True
Once you're done, you can try to run the exporter with
nakivo_prometheus_exporter --config-file=/etc/nakivo_prometheus_eporter.yaml
Once running, you might want to check the metrics with:
curl http://localhost:9119/metrics
If everything works, you can use the provided systemd service file from the systemd directory, copy it into /etc/systemd/system and run the service with
systemctl enable --now nakivo_prometheus_exporter
Since on every scraping, the exporter connects to ALL Nakivo API endpoints defined in the host section, you should set the scraper interval to something reasonable like 1 hour, and increase the scrape timeout value to one minute (see the prometheus.yml example file).
This is a quick and dirty proof of concept, only fetching backup states/duration/sizes and licensing state.
There's still quiescing information missing (didn't find it in the (Nakivo API)[https://helpcenter.nakivo.com/api-reference/Content/API-Reference-Overview.htm])
If some traction is obersved for the project, we might add missing or interesting metrics.
While this typically targets Linux, one can run this exporter on Windows, as single threaded instance without concurrency. Running as service can be achieved via nssm.
You can enable debugging in order to have more info with
export _DEBUG=true
/usr/local/bin/nakivo_prometheus_exporter -c /etc/nakivo_prometheus.exporter.yaml
Write us ;)


