Welcome to the project site for Payload Aware Network Observability (PANO).
The goal of this project is to provide observability to networking levels 5, 6, and 7. Typical observability tools only look at layers 3 and 4, outputing flow logs, which summarize traffic flow by 5-tuple. A great deal of information can be captured looking at higher level protocols, such as DNS, HTTP, LDAP, SSL/TLS, SIP, etc. As an example of PANO's utility, we present a demo using DNS.
While several approaches to this problem are possible, we sought to take a balanced one, in terms of trading off efficiency vs. generality. For example, while we could do everything in kernel space with eBPF, that would require constant changes to the kernel. Similarly, using python for everything would be fast and simple, but slow due to the generality. Instead, we strike a middle ground: we use eBPF in the kernel for packet filtering and capture, for performance reasons, and C++ or Go in user-space for efficient flexibility. Where possible, where it makes sense, we re-use existing industry-standard tools.
As an observability tool, PANO consists of a pipeline of service components. The pipeline captures raw packets, analyzes them, outputs metrics, and displays them on a dashboard. A major difference with other tools is that it does not depend on the support of a specific server (e.g., a specific DNS server such as coredns). It uses raw packets captured on the network to reconstruct the behavior of the server.
More detail can be found in a PPT deck here.
- RedHat's NetObserv eBPF Agent -- to capture relevant packets
- The Zeek Network Security Monitoring Tool -- to analyze the relevant packets and emit the resulting logs
- Apache Kafka -- to communicate between components
- RedHat's Flowlogs Pipeline -- to convert logs to metrics
- CNCF's Prometheus -- to scrape metrics and centrally store them
- Grafana Labs Grafana -- to visualize and display the metrics via a dashboard
Changes needed to the components consisted of the following:
- Code Changes:
- NetObserv eBPF Agent: Extensions to allow Full Packet Capture using eBPF, in addition to flow-logs. The changes are currently in a pull request. They are scheduled for inclusion in Netobserv 1.6.
- Package Additions:
- An Open-Soure Zeek Package that provides the Zeek Network Security Monitoring Tool with PCAP-over-TCP functionality. Zeek itself requires no code changes.
- Configuration (but no code changes):
- Flowlogs Pipeline to handle DNS logs. Config file available here.
- Grafana to add a DNS dashboard. Dashboard available here.
- CNCF's Prometheus -- Minimal configuration. Config file available here.
- No Changes at all:
- Apache Kafka
To illustrate PANO, we demonstrate a use case with DNS. We configure the NetObserv eBPF Agent to capture all packets on UDP Port 53, the default DNS port.
In addition to our pipeline, we use two instances of a DNS load generation tool, DNS-OARC's dnsperf. One instance queries 8.8.8.8 (Google's DNS server) and another instance queries 9.0.0.1 (IBM's DNS server) simultaneously, using a sample DNS querylist from a trace taken at yorktown.ibm.com.
We have a demo of PANO's capabilities running in Docker.
A recording of the demo is available here.
You will need the following to run the demo:
- A Linux bare-metal machine or VM (we tested on
Ubuntu 22.04.3 LTS). - A relatively new Linux Kernel that supports CAP_BPF in Docker (tested on
5.15.0-78-generic). - Git - to check out the source tree (should be included in your Linux).
- Bash - to build the docker images from standard components (should be included in your Linux).
- Docker and docker-compose (or "docker compose") that support "host" networking (for Ubuntu get them here and here).
Run
git clone git@github.com:netobserv/pano-research.git
to check out the source tree.
Run build-me.sh in the demo1 subdirectory:
build-me.sh
You should see various component images downloading and some building.
In the demo1 subdirectory:
Run docker compose up -d
docker compose up -d
OR docker-compose up -d
docker-compose up -d
depending on which version of docker and docker-compose you have.
You should see the various components come up:
Creating netobserv-ebpf-agent ... done
Creating zeek                 ... done
Creating kafka                ... done
Creating flowlogs-pipeline    ... done
Creating prometheus           ... done
Creating grafana              ... done
Creating dnsperf1             ... done
Creating dnsperf2             ... done
Now in a browser window, go to:
http://pano.sl.cloud9.ibm.com:3000/
(if you are running on a different machine, substitute your-machine-name for pano.sl.cloud9.ibm.com)
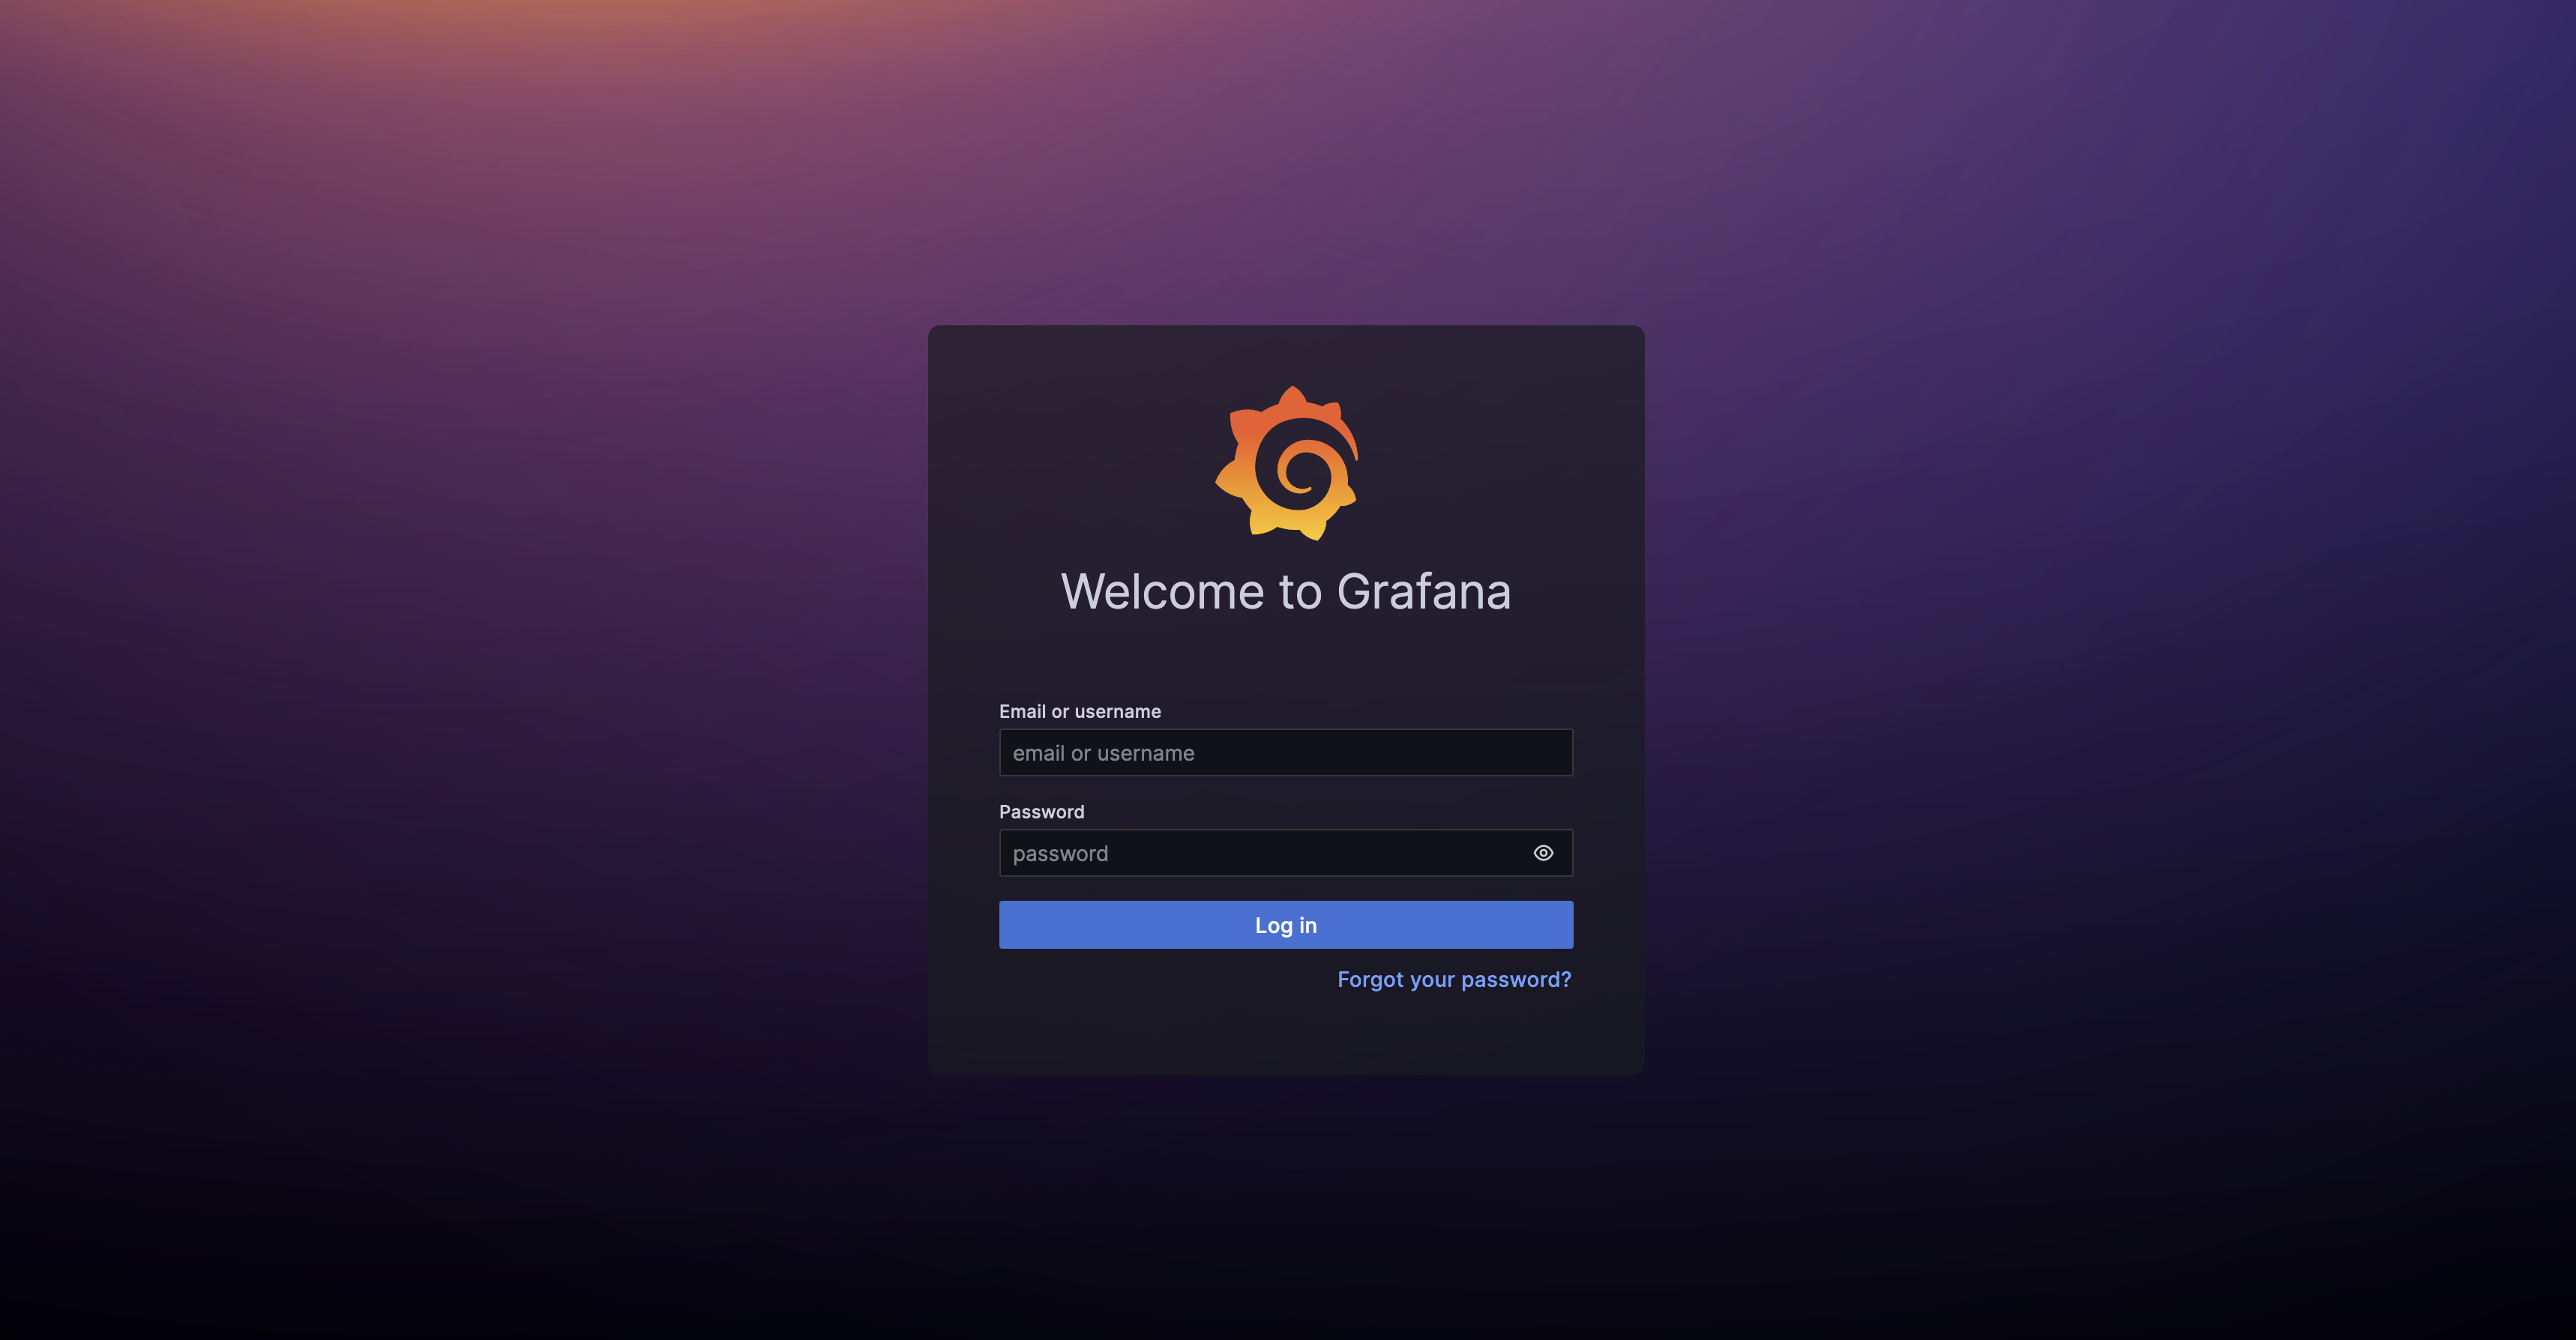
The first time you do this, you will see the following:
Grafana is asking you to log in. The credentials are admin and admin. If you change them, you must remember them for next time.
Our advice is to not change them and skip the password change.
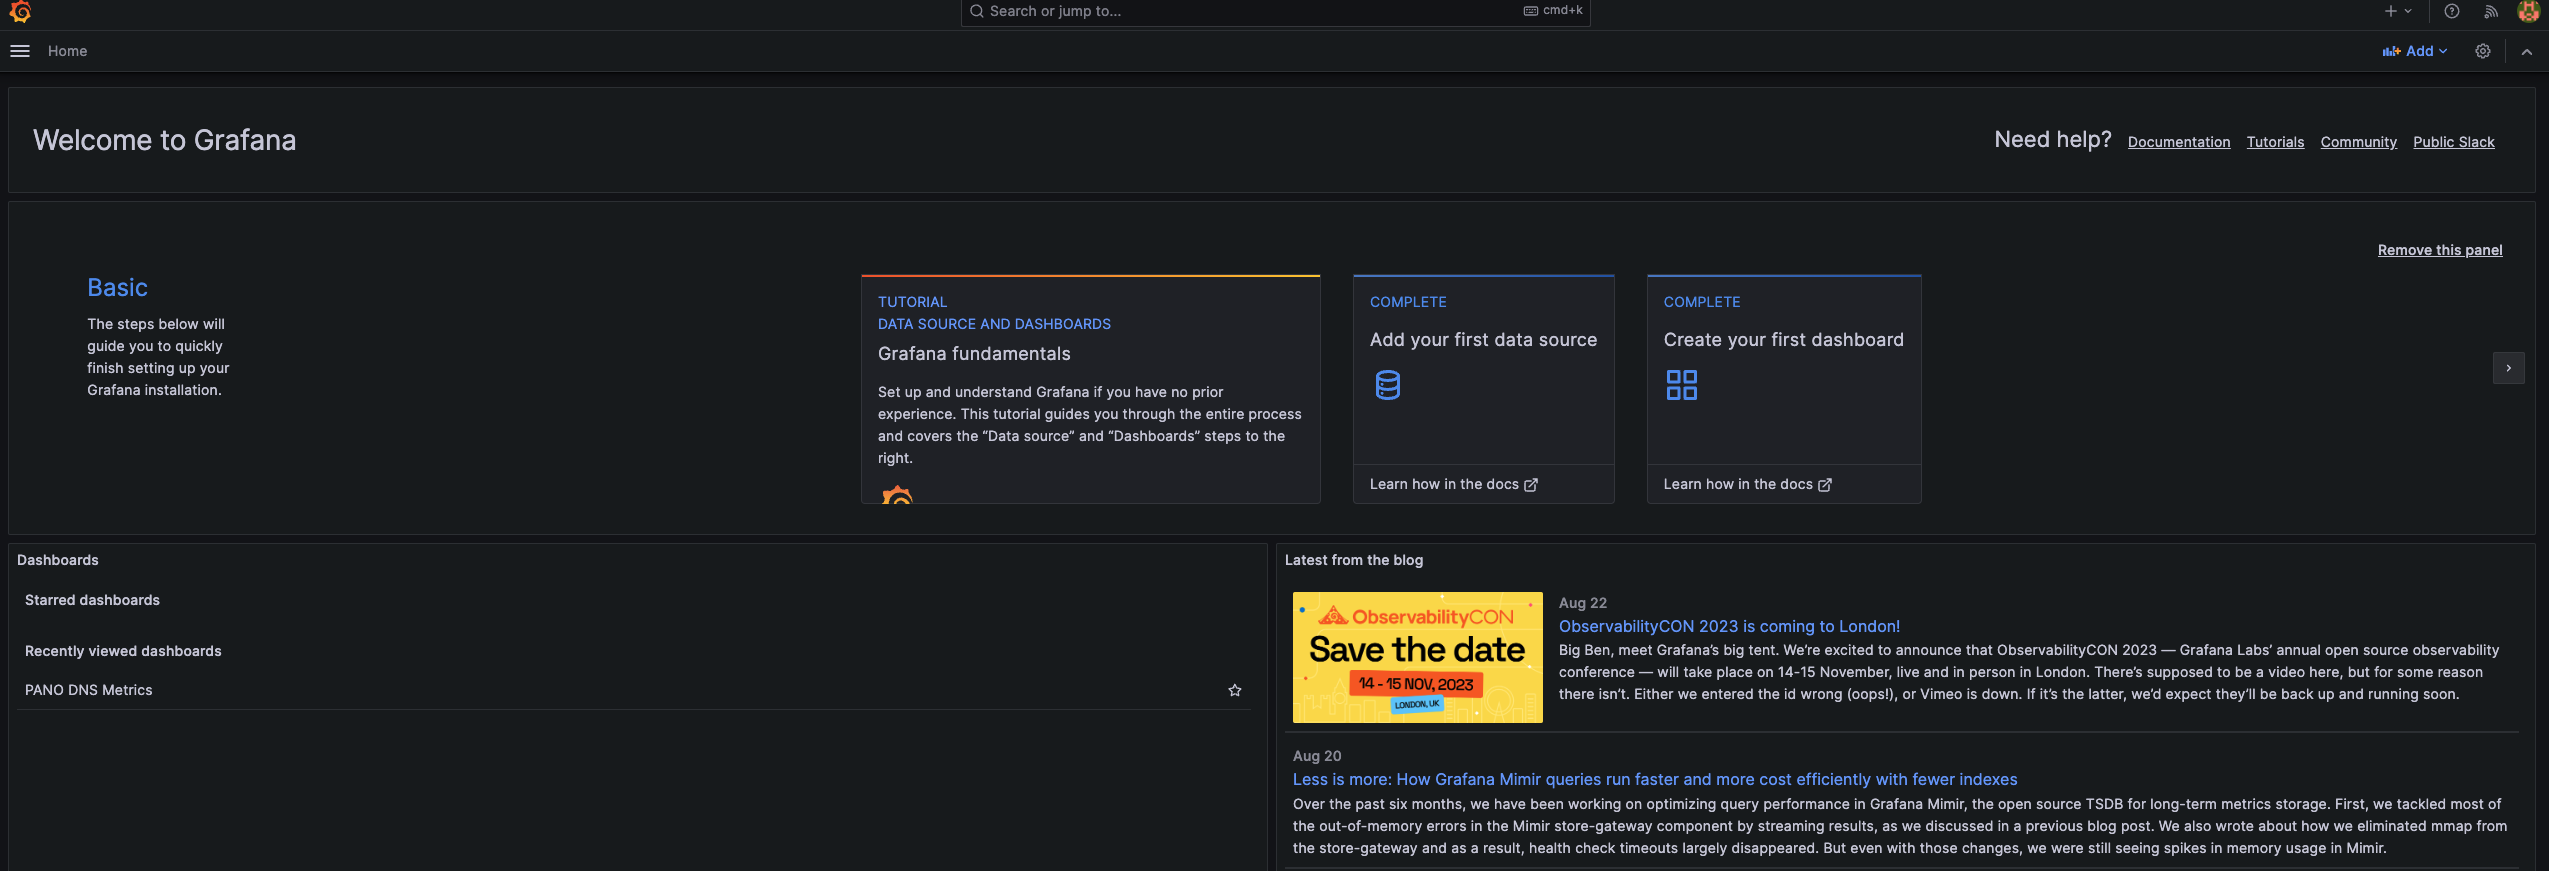
You may be presented with a Dashboard page. If so, click the Home button in the upper left.
You should see a Welcome page:
In the lower left corner, click on the PANO DNS Metrics.
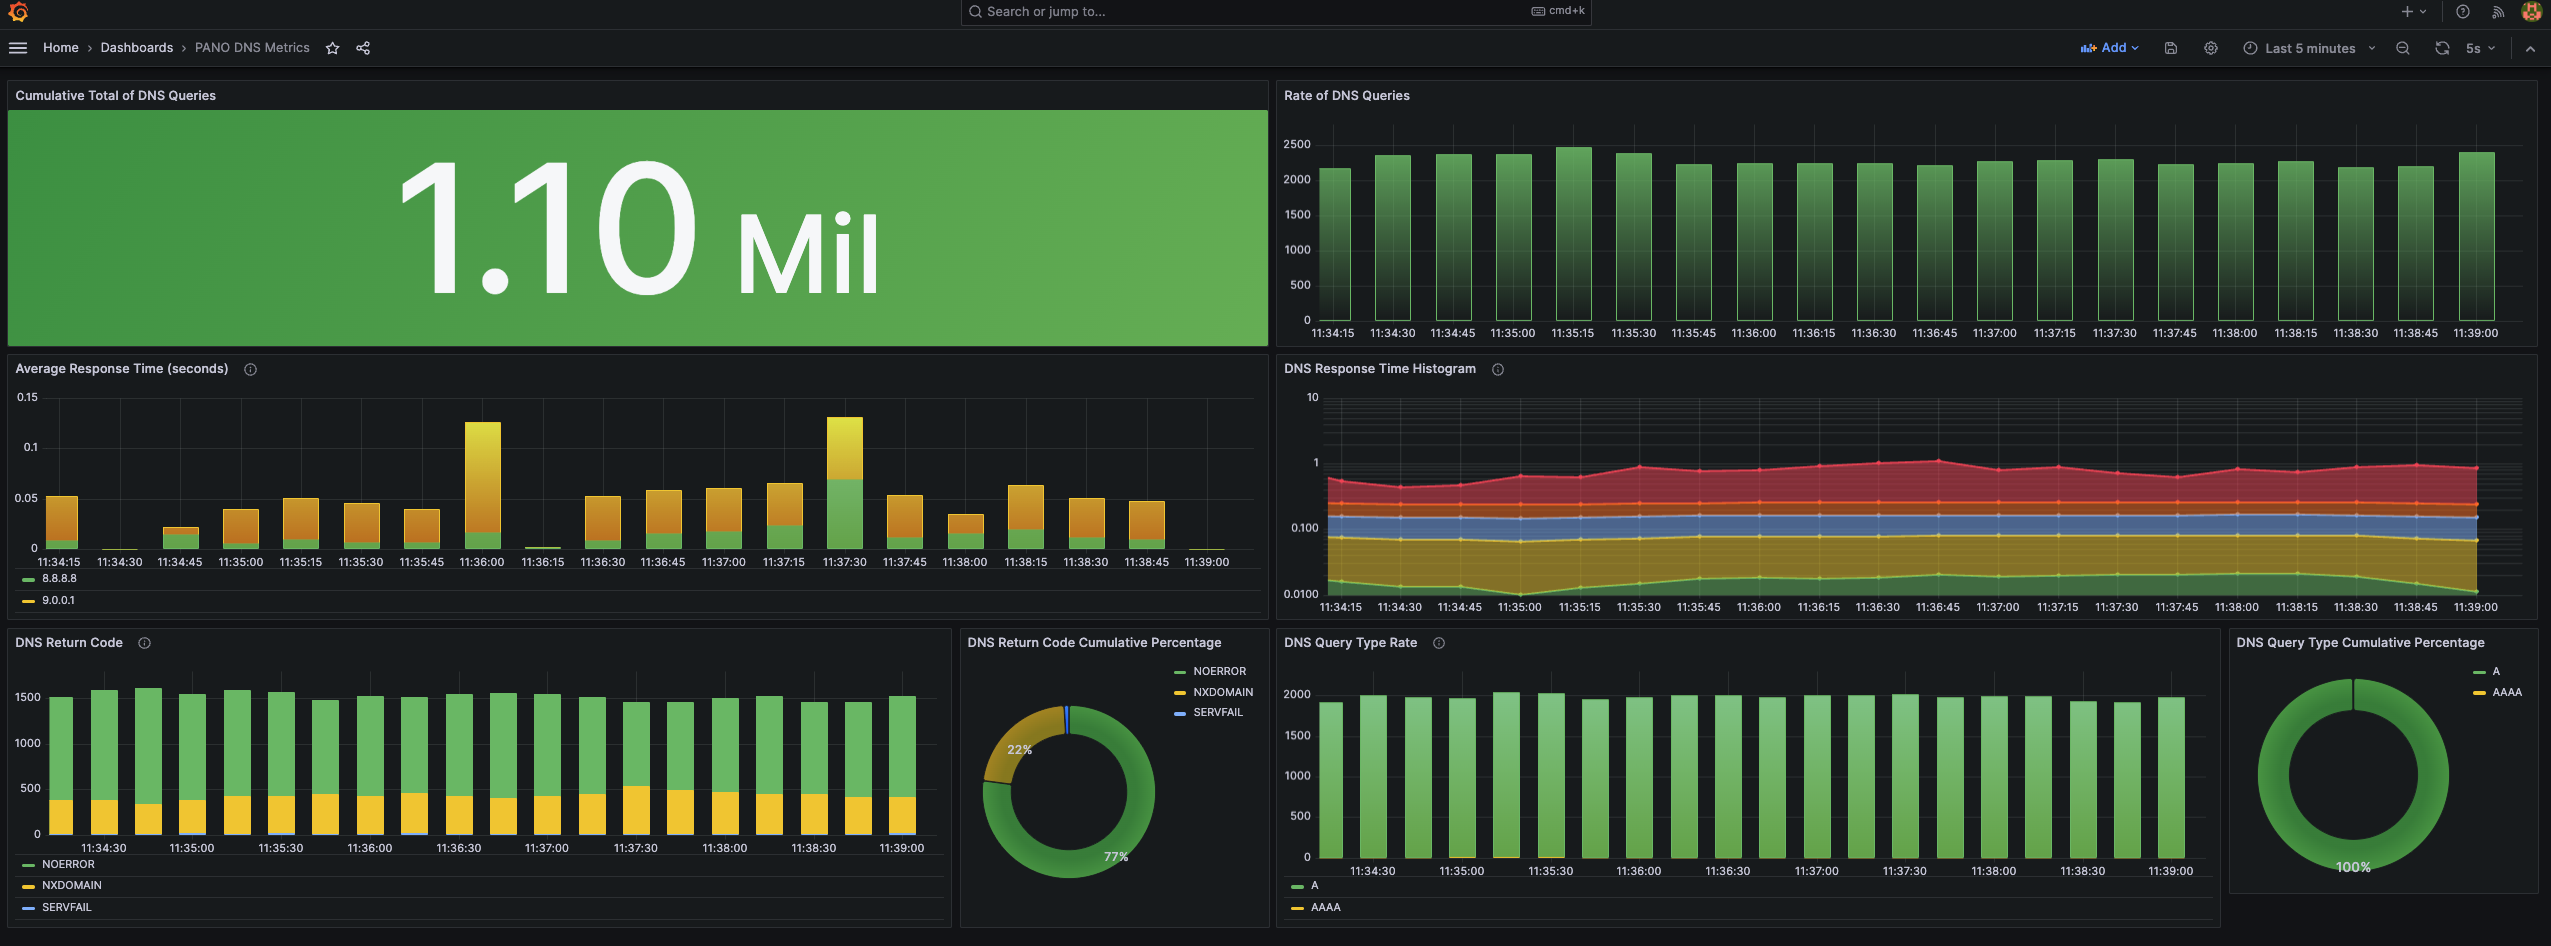
You should see something like the following:
At first, the page will not display anything, but in about 10-15 seconds it should start to populate.


