Introduction to Markov Chain, Process, and Hidden Markov Model
Markov process and Markov chain
Both processes are important classes of stochastic processes. To put stochastic process in to simpler term, imagine we have bag of multi-colored balls and we continue to pick the ball out of the bag without putting them back. In such way, a stochastic process begins to exist with color for the random variable, but it does not satisfy the Markov property. Because each time the balls are removed, the probability of getting next certain color ball may be drastically different. However, if we allow the balls to be put back into the bag, still, this creates a stochastic process with color for the random variable. However, this satisfies the Markov property.
With this, Markov chain is a stochastic process, however the Markov chain must be memory-less, which is the future actions are not dependent upon the steps that lead up to the present state. This property is called the Markov property.
Hidden Markov Model (HMM)
Hidden Markov Models (HMMs) are probabilistic models, it implies that the Markov Model underlying the data is hidden or unknown. More specifically, we only know observational data and not information about the states.
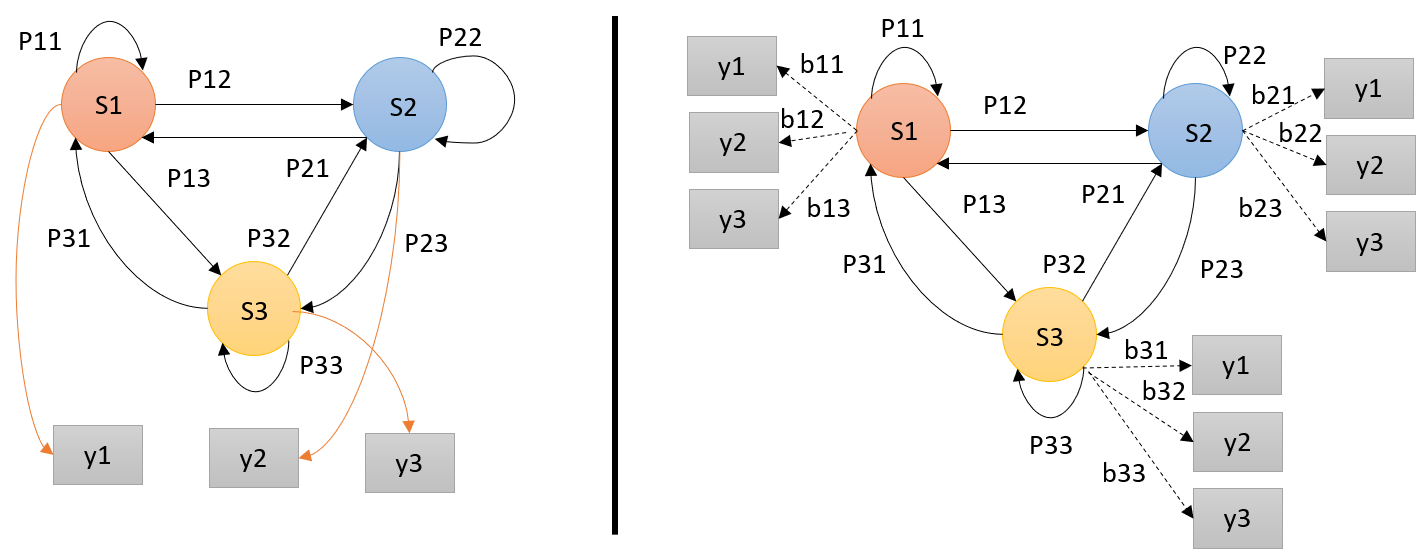
From Markov Chain (left) to Hidden Markov Model (right); where S=states, y=possible observations, P=state transition probabilities and b=observation probabilities.
HMM is determined by three model parameters;
- The start probability; a vector containing the probability for the state of being the first state of the sequence.
- The state transition probabilities; a matrix consisting of the probabilities of transitioning from state Si to state Sj.
- The observation probability; the likelihood of a certain observation, y, if the model is in state Si.
Use case on Quantitative Finance
In the code section, I have demonstrated how we can think of Regime within the time series data as the hidden state and use the Gaussian model to identify the regime (three regimes: low, neutral, and high volatility, for this example).

Mapping those regimes onto the previous stock price.

Please refer to the code section for the full code and explanation.