Set of tools to get statistics from UCCX database and parse it for further processing in wallboard and history graphs.
- Python 3+ with pyodbc module installed.
- IBM Informix driver as part of Informix Client SDK installed. uccx-dsn.dsn is an example file of ODBC configuration on Windows. odbcinst.ini is an example file of ODBC configuration on Linux.
- Unix-only: unixODBC package installed and configured. See guide.
- UCCX real-time data collecting enabled at "Tools -> Real Time Snapshot Writing Configuration" with both "CCX CSQs Summary" and "CCX System Summary" options.
uccx_getcsqstat_loop.py collects statistics for every existing CSQ in _uccx_csqstats.txt and summary statistics across all CSQs in _uccx_overall.txt. Default interval is 10 seconds and you can set it to your desired value, even 1 second is alright.
Create systemd service such as /lib/systemd/system/getcsq.service
[Unit]
Description=CSQ Statistics
After=multi-user.target
Conflicts=getty@tty1.service

[Service]
Type=simple
Restart=always
User=getcsq
Group=getcsq
Environment="INFORMIXDIR=/opt/IBM/informix"
Environment="LD_LIBRARY_PATH=/opt/IBM/informix/lib:/opt/IBM/informix/lib/cli:/opt/IBM/informix/lib/esql"
Environment="INFORMIXSQLHOSTS=/opt/IBM/informix/etc/sqlhosts"
WorkingDirectory=/opt/uccx-stats/
ExecStart=/usr/bin/python3 /opt/uccx-stats/uccx_getcsqstat_loop.py
StandardInput=tty-force

[Install]
WantedBy=multi-user.target
Enable and start service
systemctl daemon-reload
systemctl enable getcsq
systemctl start getcsq
uccx_parse.py extracts value from text file. Use it to fill data on your monitoring system or database directly.
First paramter is file name, second is variable, for example:
python3 uccx_parse.py _uccx_csqstats.txt 'Sales_CSQ - loggedinagents'
Colledted items are:
- active (= working + talking + reserved + available),
- loggedinagents,
- availableagents,
- unavailableagents,
- talkingagents,
- callswaiting,
- totalcalls,
- callshandled,
- callsabandonded,
- callsdequeued,
- callratio (= handled / total),
- avgtalkduration,
- avgwaitduration,
- longesttalkduration,
- longestwaitduration,
- oldestcontact.
For overall:
- active,
- loggedinagents,
- availableagents,
- unavailableagents,
- totalcalls,
- callswaiting,
- callshandled,
- callsabandoned.
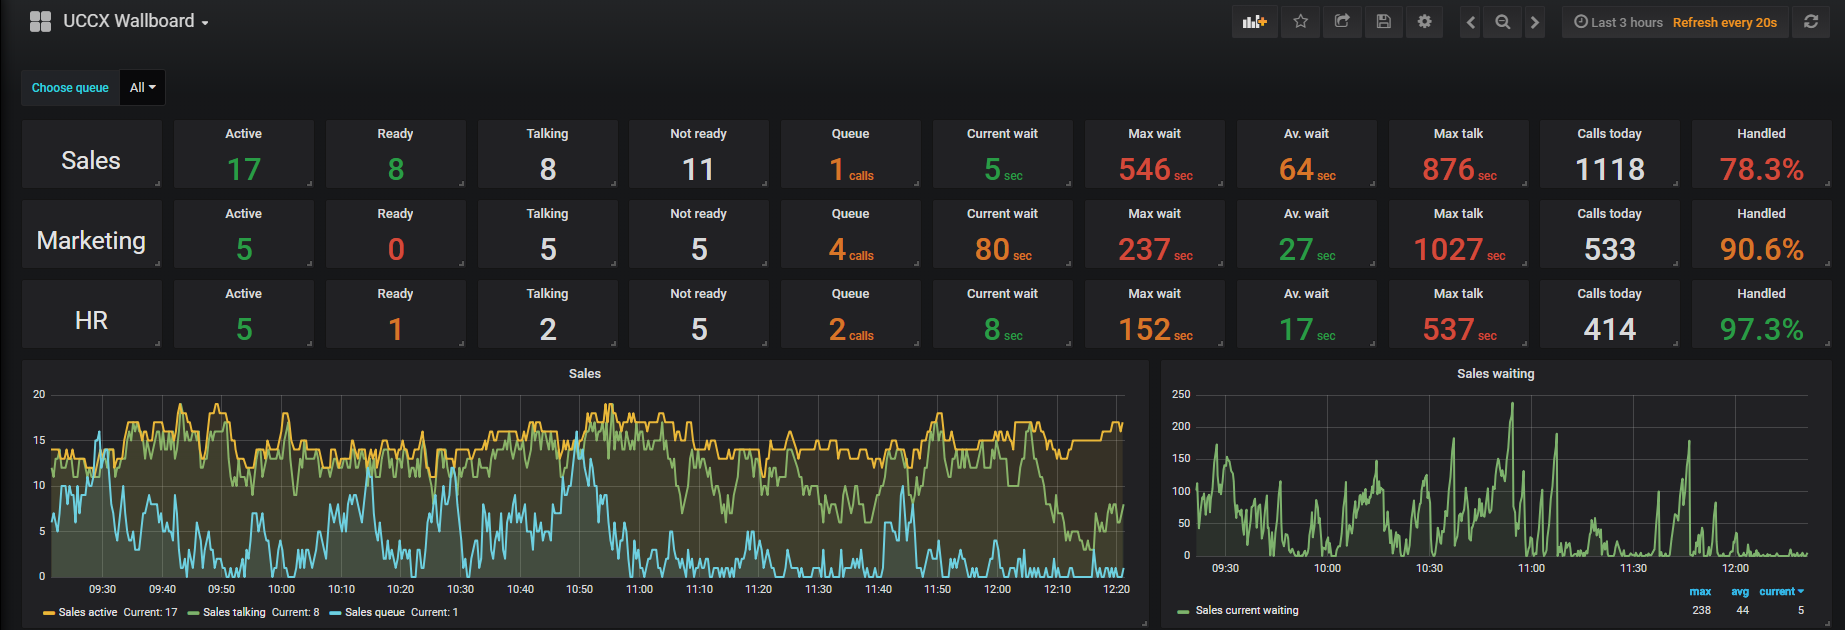
This is what it looks like on Grafana using Zabbix datasource. Please don't ask to share dashboard since I only have customized for my environment. Make your own is an easy part.
