fmriqa
Overview
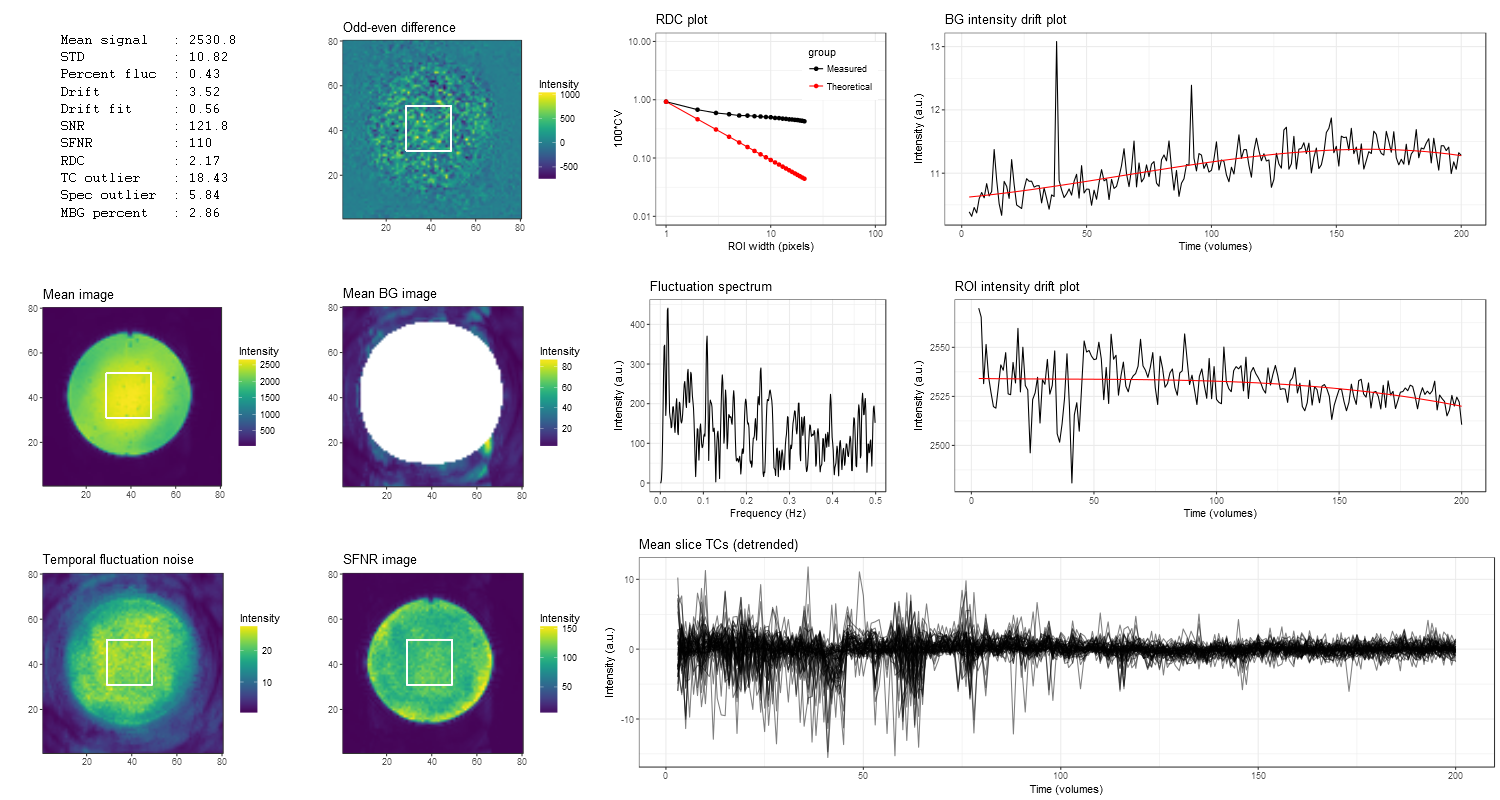
The fmriqa package provides an implementation of the fMRI quality assurance (QA) analysis protocol detailed by Friedman and Glover (2006) doi:10.1002/jmri.20583.
Installation
You can install the stable version of fmriqa from CRAN:
install.packages("fmriqa", dependencies = TRUE)Or the the development version from GitHub (requires devtools package):
install.packages("devtools")
devtools::install_github("martin3141/fmriqa")
Usage
# load the package
library(fmriqa)

# get help on the options for run_fmriqa
?run_fmriqa

# run the analysis - a file chooser will appear when a data_file argument is not given
run_fmriqa()
Real data example
library(fmriqa)
fname <- system.file("extdata", "qa_data.nii.gz", package = "fmriqa")
res <- run_fmriqa(data_file = fname, gen_png = FALSE, gen_res_csv = FALSE, tr = 3)
## Reading data : C:/Users/home/Documents/R/win-library/3.4/fmriqa/extdata/qa_data.nii.gz
##
## Basic analysis parameters
## -------------------------
## X,Y dims : 80x80
## Slices : 1
## TR : 3s
## Slice # : 1
## ROI width : 21
## Total vols : 200
## Analysis vols : 198
##
## QA metrics
## ----------
## Mean signal : 2561.3
## STD : 6.4
## Percent fluc : 0.25
## Drift : 2.06
## Drift fit : 1.42
## SNR : 141.3
## SFNR : 137
## RDC : 2.84
## TC outlier : 2.66
## Spec outlier : 5.12
Simulation example
library(fmriqa)
library(oro.nifti)
## oro.nifti 0.7.2
# generate random data
set.seed(1)
sim_data <- array(rnorm(80 * 80 * 1 * 100), dim = c(80, 80, 1, 100))
sim_data[20:60, 20:60, 1, ] <- sim_data[20:60, 20:60, 1, ] + 50
sim_nifti <- oro.nifti::as.nifti(sim_data)
fname <- tempfile()
writeNIfTI(sim_nifti, fname)

# perform qa
res <- run_fmriqa(fname, gen_png = FALSE, gen_res_csv = FALSE)
## Reading data : C:\Users\home\AppData\Local\Temp\Rtmpue4USt\file205c578c3088
##
## Basic analysis parameters
## -------------------------
## X,Y dims : 80x80
## Slices : 1
## TR : 1s
## Slice # : 1
## ROI width : 21
## Total vols : 100
## Analysis vols : 98
##
## QA metrics
## ----------
## Mean signal : 50
## STD : 0.05
## Percent fluc : 0.09
## Drift : 0.45
## Drift fit : 0.06
## SNR : 51.7
## SFNR : 51.2
## RDC : 21.77
## TC outlier : 2.74
## Spec outlier : 4.04
res$snr## [1] 51.74954
