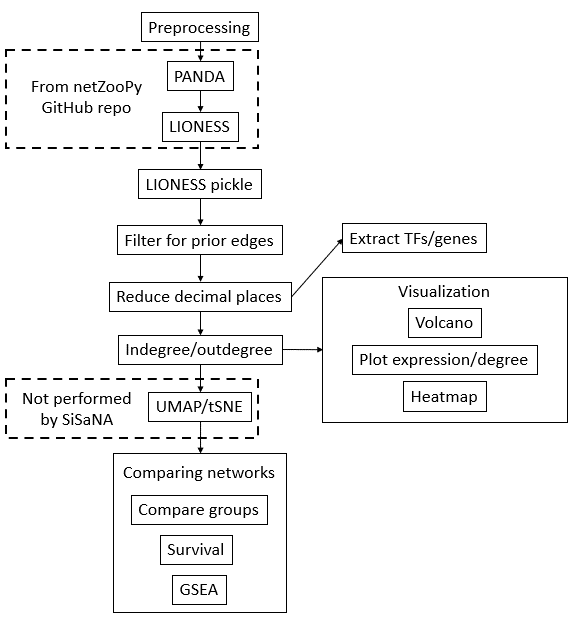
Single Sample Network Analysis
SiSaNA is used both before and after creating both PANDA and LIONESS networks from the package netZooPy. SiSaNA first needs to pre-process the data to be ran in PANDA/LIONESS. SiSaNA takes the LIONESS output, processes it to be analyzed downstream, and then calculates in- and out-degree for each of the reconstructed networks. Additionally, it can compare the expression/degree between groups of interest, including performing statistical tests, visualizing the results (volcano plots, boxplots, and violin plots), and compare the survival between groups.
Note: The steps below are for the basic use of SiSaNA. There are other functionalities across different scripts that are not covered in this file.
- python v3.9.19 (see installation steps for creating a conda environment with this specific Python version). SiSaNA may work with other versions of Python as well, but has been written and tested on this version.
- A cloned repo of netZooPy (https://github.com/netZoo/netZooPy/tree/master)
- Create a conda virtual environment with python 3.9.19.
conda create --prefix /path/to/env-name python=3.9.19
- Enter the conda environment
conda activate /path/to/env-name
- Clone this repo
git clone https://github.com/newmanno/sisana.git
- Move into the repo directory, then run the following command to install the required modules
cd sisana
pip3 install -r requirements.txt
- Install the newest netZooPy module
conda install -c netzoo -c conda-forge netzoopy
This step is actually performed prior to running PANDA/LIONESS, and it filters the expression matrix, PPI file, and prior motif to contain the same genes/TFs, which is necessary for running PANDA/LIONESS.
python preprocess.py -e expression_file.tsv -m motif_file.txt -p ppi_file.txt -n 10 -o ./output/
-e: Path to file containing the gene expression data. Row names must be genes, the expression file does not have a header, and the cells are separated by a tab-m: Path to motif file, which gets filtered to only contain genes that pass the minimum number of samples threshold-p: Path to ppi file, which gets filtered to only contain genes that pass the minimum number of samples threshold-n: Minimum number of samples a gene must be expressed in; expression data will be filtered for only genes that pass-o: Path to output directory
Three files, one for each of the three filtered input files.
This step creates a PANDA network from the filtered files. See documentation for netZooPy (https://github.com/netZoo/netZooPy/tree/master). An example command is given below.
python run_panda.py -e expression_data_filtered.txt -m motif_data_filtered.txt -p ppi_data_filtered.txt -r True -o output_file.txt
Similar to the PANDA step, this step creates LIONESS networks from the filtered files. See documentation for netZooPy (https://github.com/netZoo/netZooPy/tree/master). An example command is given below.
python run_lioness.py -e expression_data_filtered.txt -m motif_data_filtered.txt -p ppi_data_filtered.txt -g cpu -r single -c 4 -o ./output/ -f mat
We now save the LIONESS output as a pickle file
python lioness_to_pickle_df.py -p panda_output.txt -q lioness_output.npy -t npy -n sampnames.txt -o ./output/lioness_df.pickle
-p: Path to pickle file created by lioness_to_pickle_df.py script-q: Path to file produced by the run_lioness.py script-t: File type of lioness input (the -q file)-n: File with list of sample names (one per line) in the same order that were supplied to run_lioness.py-o: Path to directory to save output file to
A single file of the LIONESS data frame in .pickle format
python filter_edges_for_prior.py -p lioness_df.pickle -m motif.tsv -o ./output -f pickle
-p: Path to pickle file created by lioness_to_pickle_df.py script-m: Path to the prior motif file used in the original PANDA/LIONESS script-o: Path to directory to output file to-f: Format of file to output the filtered network to (either csv or pickle)
A single output file in either csv or pickle format, filtered for only the edges that were known prior interactions
Now, we reduce the number of decimal places in the output file to save on storage space.
python reduce_number_decimal_places.py -n lioness_df.pickle -i pickle -o ./output/ -f csv -d 3
-n: Path to either the indegree/outdegree file from lioness_df_indeg_outdeg_calculator.py or the LIONESS output file-i: File type of the input file (either pickle or csv)-o: Path to directory to output file to-f: File type of output file-d: Number of decimal points to truncate the degrees to
A single file with indegree/outdegree measurements truncated to the desired number of decimal points
Once the LIONESS networks are made, a simple analysis to do is to calculate the in- and out-degrees of the nodes in the network, which is done in this step.
python lioness_df_indeg_outdeg_calculator.py -i lioness_df.pickle -t pickle -o ./output/
-i: Path to lioness file, either in .csv format or the .pickle file created by lioness_to_pickle_df.py script-t: File type of LIONESS input file (-q)-o: Path to pickle file to output
CSV files for both indegree (also known as gene targeting score) and outdegree
Then, one can compare the in- and out-degrees between two treatment groups, using either a Student's t-test or a Mann-Whitney test (or for paired samples, one can use either a paired t-test or Wilcoxon signed-rank test).
python compare_degrees.py -m mapping_file.csv -p indegree/outdegree file.csv -c high low -t mw -o ./output/
-m: Path to mapping file (csv). If doing an unpaired test (--testtype = mw or tt) then this file maps samples (first column, no header) to groups (second column, no header). Otherwise, if doing a paired analysis (--testtype = paired_tt or wilcoxon) then the samples for one group will go in column 1 (no header) while their paired samples will go in column 2.-p: Path to csv file containing the degrees (in/out) of each node-c: A list (two strings) of the groups in the mapping file to perform comparisons between. Required if not performing a paired analysis.-t: Type of comparison to perform, either Student's t-test, Mann-Whitney U, paired t-test, or Wilcoxon-o: Path to directory to output file to
A single csv file containing the input degree dataframe, as well as the p-values and adjusted p-values (FDR) for each gene
