An OVS-DPDK telemetry exporter
The recommended way when running locally. Remember to mount the OVS run dir as a volume and add extra options to the command line, e.g.:
$ docker run --rm \
	--name exporter \
	--publish 8000:8000 \
	--mount type=bind,source=/var/run/openvswitch,target=/var/run/openvswitch/ \
	nfvri/ovs-dpdk-telemetry-exporter \
ovsDpdkTelemetryExporter -vvv -T 5To run as a sidecar, add the exporter container to your Deployment/Statefulset/Daemonset definition
with mount access to the OVS run directory (usually /var/run/openvswitch) as follows:
apiVersion: apps/v1
kind: Deployment
...
spec:
  template:
    spec:
      containers:
      - name: telemetry-exporter
        imagePullPolicy: Always
        image: nfvri/ovs-dpdk-telemetry-exporter:0.1
        command: ["ovsDpdkTelemetryExporter"]
        args: ["-vvv"]
        volumeMounts:
           - mountPath: /var/run/openvswitch/
             name: ovsrun-volume
        resources:
          requests:
            memory: "1Gi"
            cpu: "1000m"
          limits:
            memory: "1Gi"
            cpu: "1000m"
        ports:
          - containerPort: 8000
...
Then assuming you have a Prometheus-operator deployment, use a Service and ServiceMonitor to
specify a target to the exporter (be careful to match the appropriate labels/namespaces for your
case):
---
apiVersion: monitoring.coreos.com/v1
kind: ServiceMonitor
metadata:
  name: ovs-dpdk-deployment-monitor
  namespace: monitoring
  labels:
    app: ovs-dpdk
    release: k8s-prom
spec:
  endpoints:
  - port: metrics
    path: /
    interval: "5s"
    scrapeTimeout: "5s"
  namespaceSelector:
    matchNames:
      - ovs-dpdk
  selector:
    matchLabels:
      app: ovs-dpdk

---
apiVersion: v1
kind: Service
metadata:
  name: ovs-dpdk-deployment-svc
  namespace: ovs-dpdk
  labels:
    app: ovs-dpdk
spec:
  ports:
  - name: metrics
    port: 8000
    protocol: TCP
  selector:
app: ovs-dpdkPlease prefer to run from the docker image. If local installation is absolutely necessary, you can install the exporter with:
$ sudo apt-get update && sudo apt-get install -y python3 python3-pip

$ python3 setup.py install
You can then run it with:
$ ovsDpdkTelemetryExporter -h
usage: OvsDpdkTelemetryExporter [-h] [-p PORT] [-T TIMEOUT] [-v] [-e EXCLUDE]

optional arguments:
  -h, --help            show this help message and exit
  -p PORT, --port PORT  OvsDpdkTelemetryExporter port (default: 8000)
  -T TIMEOUT, --timeout TIMEOUT
                        The update interval in seconds (default: 5)
  -v, --verbose         Set output verbosity (default: -vv = INFO)
  -e EXCLUDE, --exclude EXCLUDE
                        Exclude collectors (usage: -e datapath -e pmd_threads)
  -d RUNDIR, --rundir RUNDIR
                        The OVS directory used for pidfiles (default: /var/run/openvswitch)
| Short | Long | Arguments | Description |
|---|---|---|---|
| -h | help | None | Show usage and exit. |
| -p | port | Port number (int) | The port number on which to expose metrics (default 8000). |
| -e | exclude | Collectors (string list) | The collectors which should be excluded (default none). |
| -d | rundir | OVS rundir (string) | The OVS directory used for pidfiles (default: /var/run/openvswitch) |
| -T | timeout | Number of seconds (int) | The number of seconds between collections (i.e. the update interval). Default is 5 (seconds) but you can modify it to your needs. |
| -v | verbose | None | Specify multiple times to set log level (default is -vv=INFO, use -vvv for DEBUG). |
All collectors are enabled by default.
| Name | Description |
|---|---|
| datapath | Exposes datapath stats from the dpctl/show -s command. |
| pmd_threads | Exposes dpdk pmd threads stats from the dpif-netdev/pmd-stats-show command. |
In the example above for Kubernetes pod sidecar run, the Prometheus target is set automatically by
prometheus-operator. If you have to manually create a target, locate your prometheus.yml file and
add a scrape config for the exporter target, using the proper ip and port where Prometheus can
contact the exporter:
  - job_name: 'ovs-dpdk-telemetry-exporter'
    scrape_interval: 5s
    scrape_timeout: 5s
    static_configs:
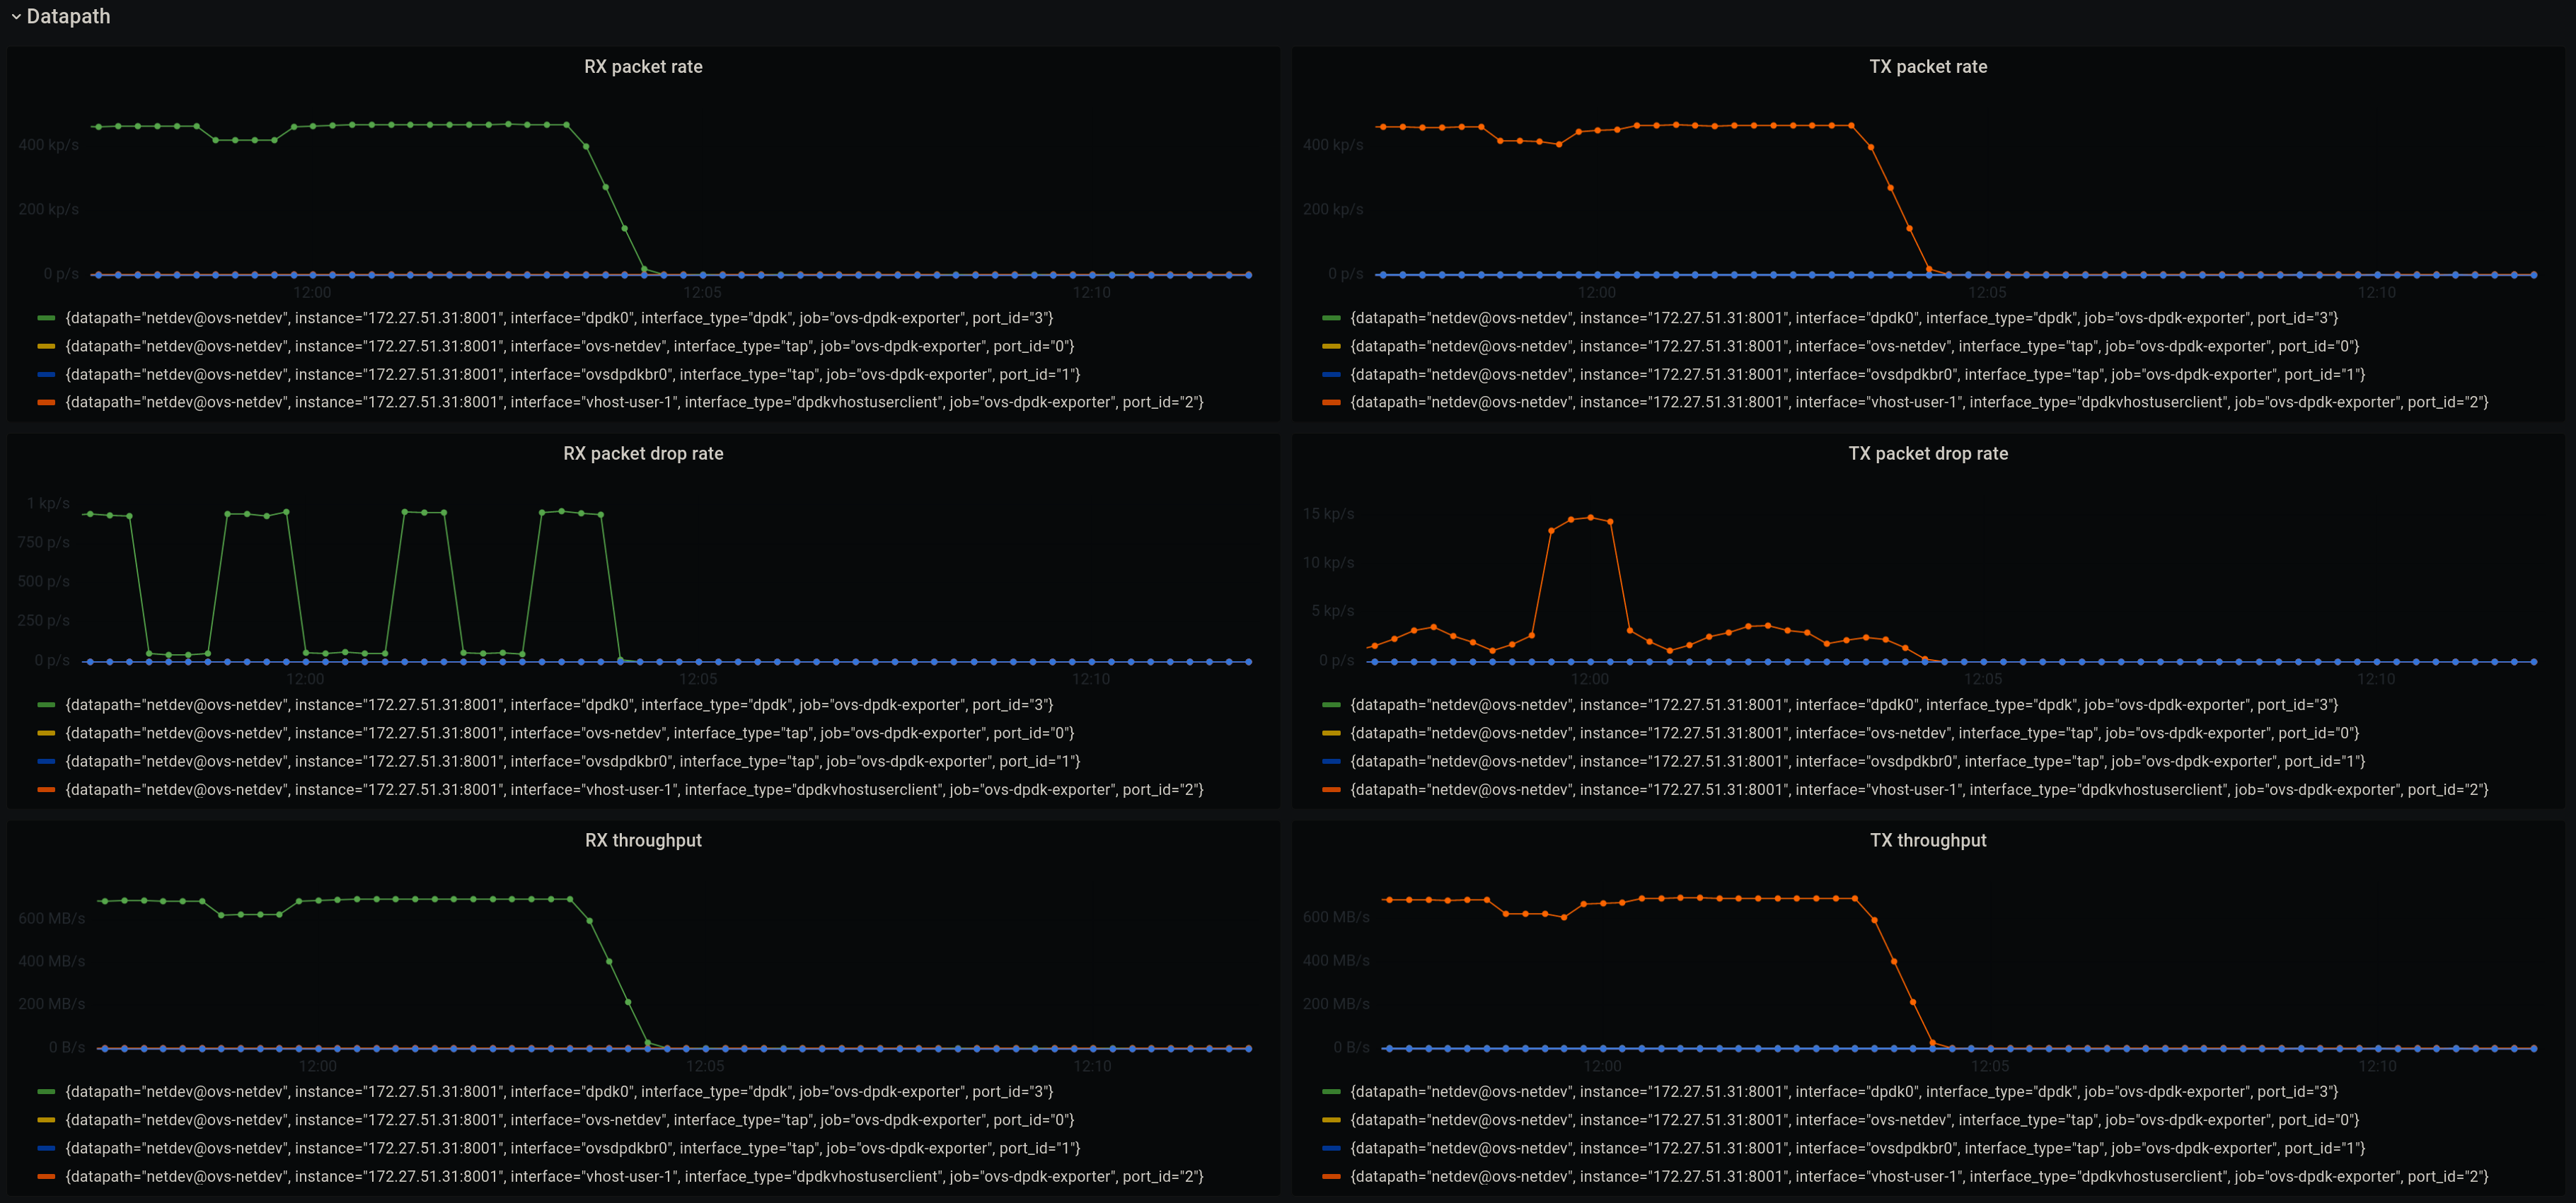
- targets: ['192.168.123.1:8000']A sample grafana dashboard is provided at grafana_dashboard.json.

