Debug PL/pg stored procedures, functions, triggers and views from Intellij IDEs (Ultimate only)
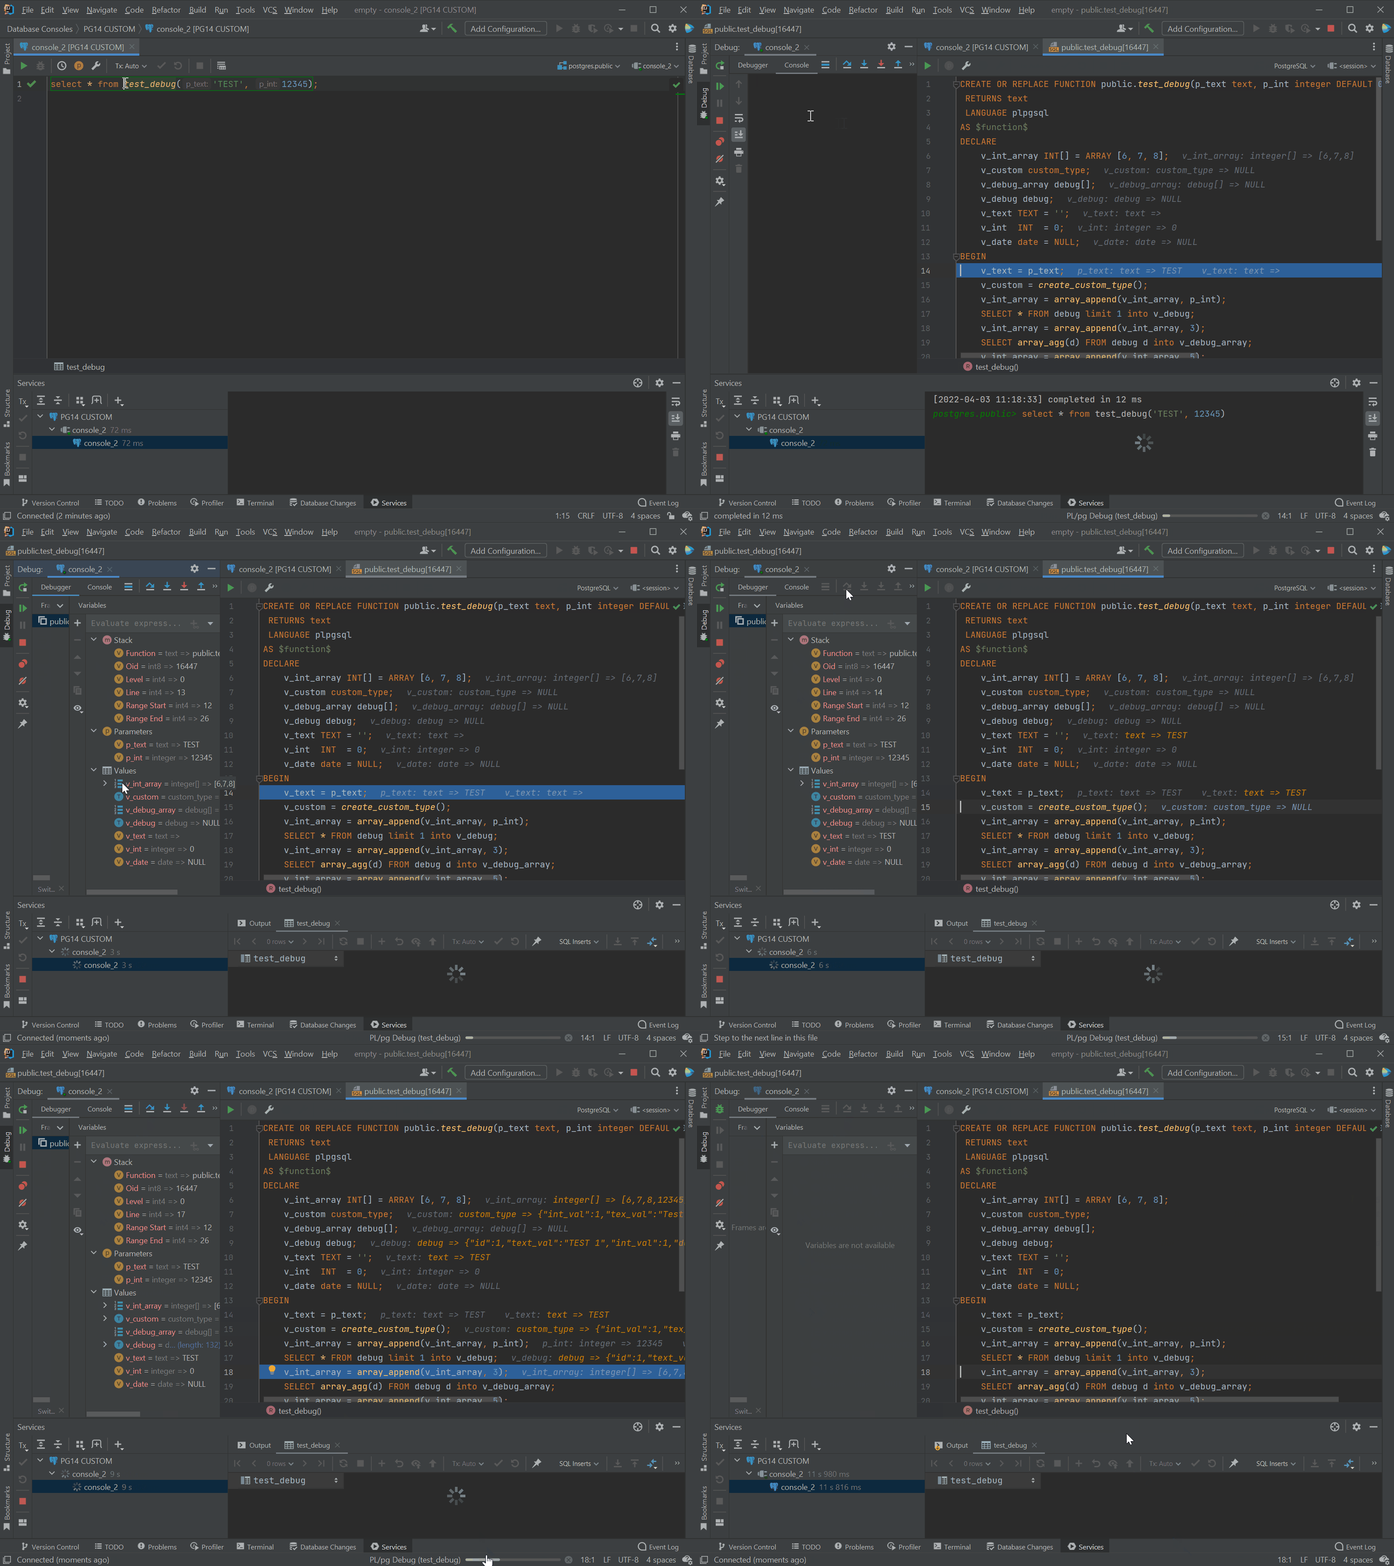
- Debug queries from editor by selecting a function call
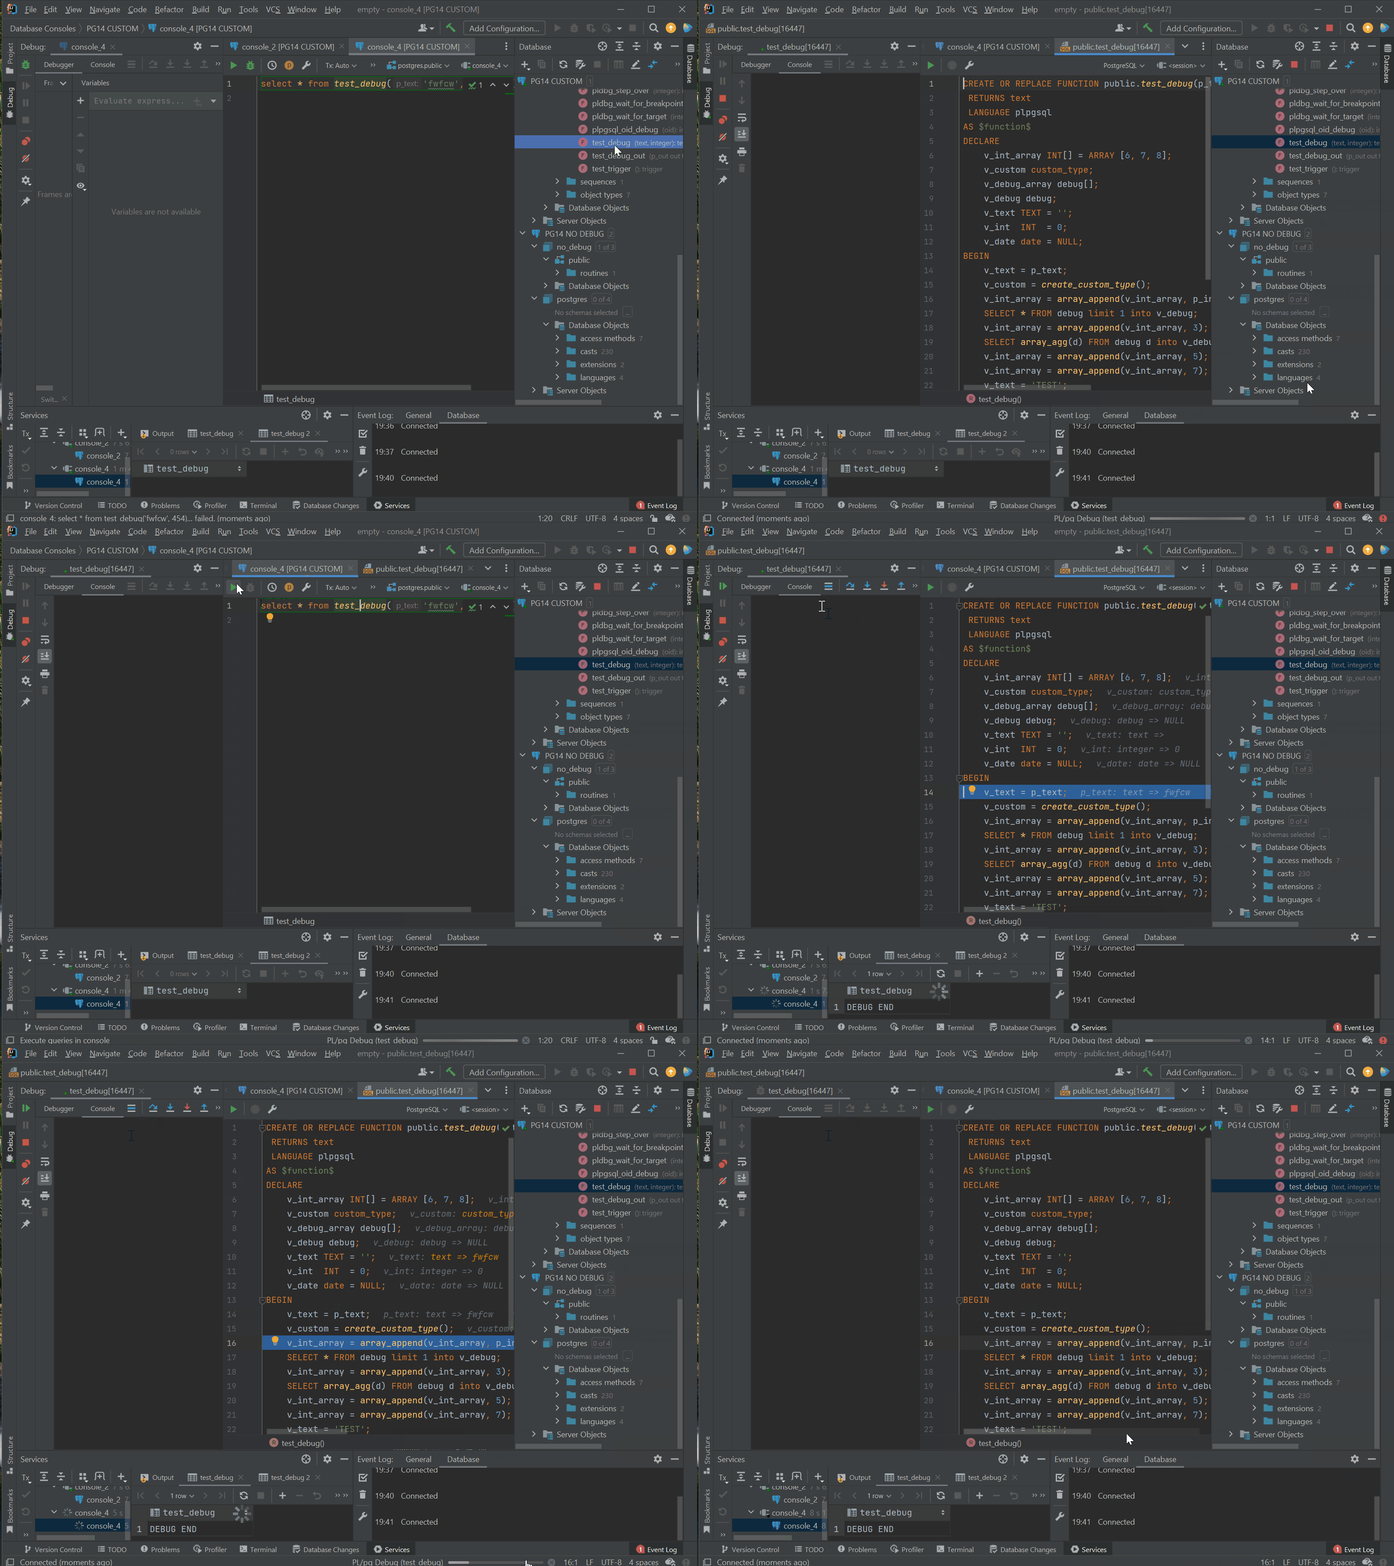
- Debug routines and triggers from database explorer
- Full support for variables inspection with Docker custom debugger
Visit the plugin page at JetBrains.
Report a bug or a problem => Create an issue
You can use the plugin with the standard pldbgapi extension, but you will not be able to inspect every variable type.
To get the full experience, you can use an enhanced version with the plugin.
You can compile the extension from the source code or use one of the Docker images available.
The Docker image is based on the official PostgreSQL image and includes the debugger extension, from version 11 to 16 for amd64 and arm64. To build your own image, you can use the Dockerfile provided.
docker run -p 5515:5432 --name PG15-debug -e POSTGRES_PASSWORD=postgres -d galien0xffffff/postgres-debugger:15Or install the debugger binaries on your machine.
Run the following command on the database where you want to debug routines
--Take care to install the extension on the public schema
CREATE EXTENSION IF NOT EXISTS pldbgapi;Just write a statement using the function you want to debug
--This is a statement in a console or in a file
SELECT function_name(args);
(click on the debug icon on the top left of the editor)
(Right-click on the routine you want to debug and select "Debug Routine")
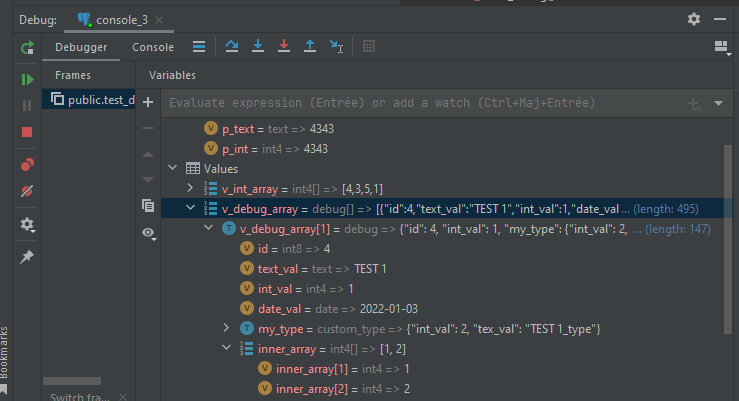
In the variables tab you can inspect:
- Primitive types
- Arrays
- JSON
With the docker image you can also inspect:
- Composite types
- Record types
Arguments and variables are displayed in the code editor
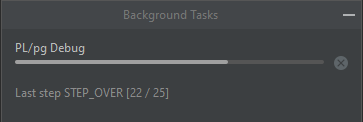
The debug session is displayed as a background process. You can stop it by clicking on the stop icon.
When you stop the debug session, the process is killed on the server side.
If you debug a routine from the code editor, the process is automatically killed when you close the editor.
If you debug a routine from the database explorer, the process remains active until you stop manually.
The standard pldbgapi does not send back composite variable, but you can put it in arrays to inspect them.
You must first install the debugger extension and activate the shared library onto the server.
EXPORT TAG = 11 # or 11, 12, 13, 14, 15
EXPORT PG_LIB=postgresql-server-dev-${TAG}
EXPORT PG_BRANCH=REL_${TAG}_STABLE
EXPORT PLUGIN_BRANCH=print-vars

# Install dependencies
apt --yes update && apt --yes upgrade && apt --yes install git build-essential libreadline-dev zlib1g-dev bison libkrb5-dev flex $PG_LIB \
#
cd /usr/src/
# Install postgres source
git clone -b $PG_BRANCH --single-branch https://github.com/postgres/postgres.git
# Setup postgres
cd postgres && ./configure
# Install debugger extension
cd /usr/src/postgres/contrib
git clone -b $PLUGIN_BRANCH --single-branch https://github.com/ng-galien/pldebugger.git
cd pldebugger
# Compile with the same options as postgres
make clean && make USE_PGXS=1 && make USE_PGXS=1 install
Follow these instructions for PgAdmin for a standard installation.
-
Using IDE built-in plugin system:
Settings/Preferences > Plugins > Marketplace > Search for "idea-plpgdebugger" > Install Plugin
-
Manually:
Download the latest release and install it manually using Settings/Preferences > Plugins > ⚙️ > Install plugin from disk...
Plugin based on the IntelliJ Platform Plugin Template.


