HNT: 13Vazr2mTQSbu2wBGAkqpaLvJQEdSv5aMd3qpdXFJSw2pfNpqC4
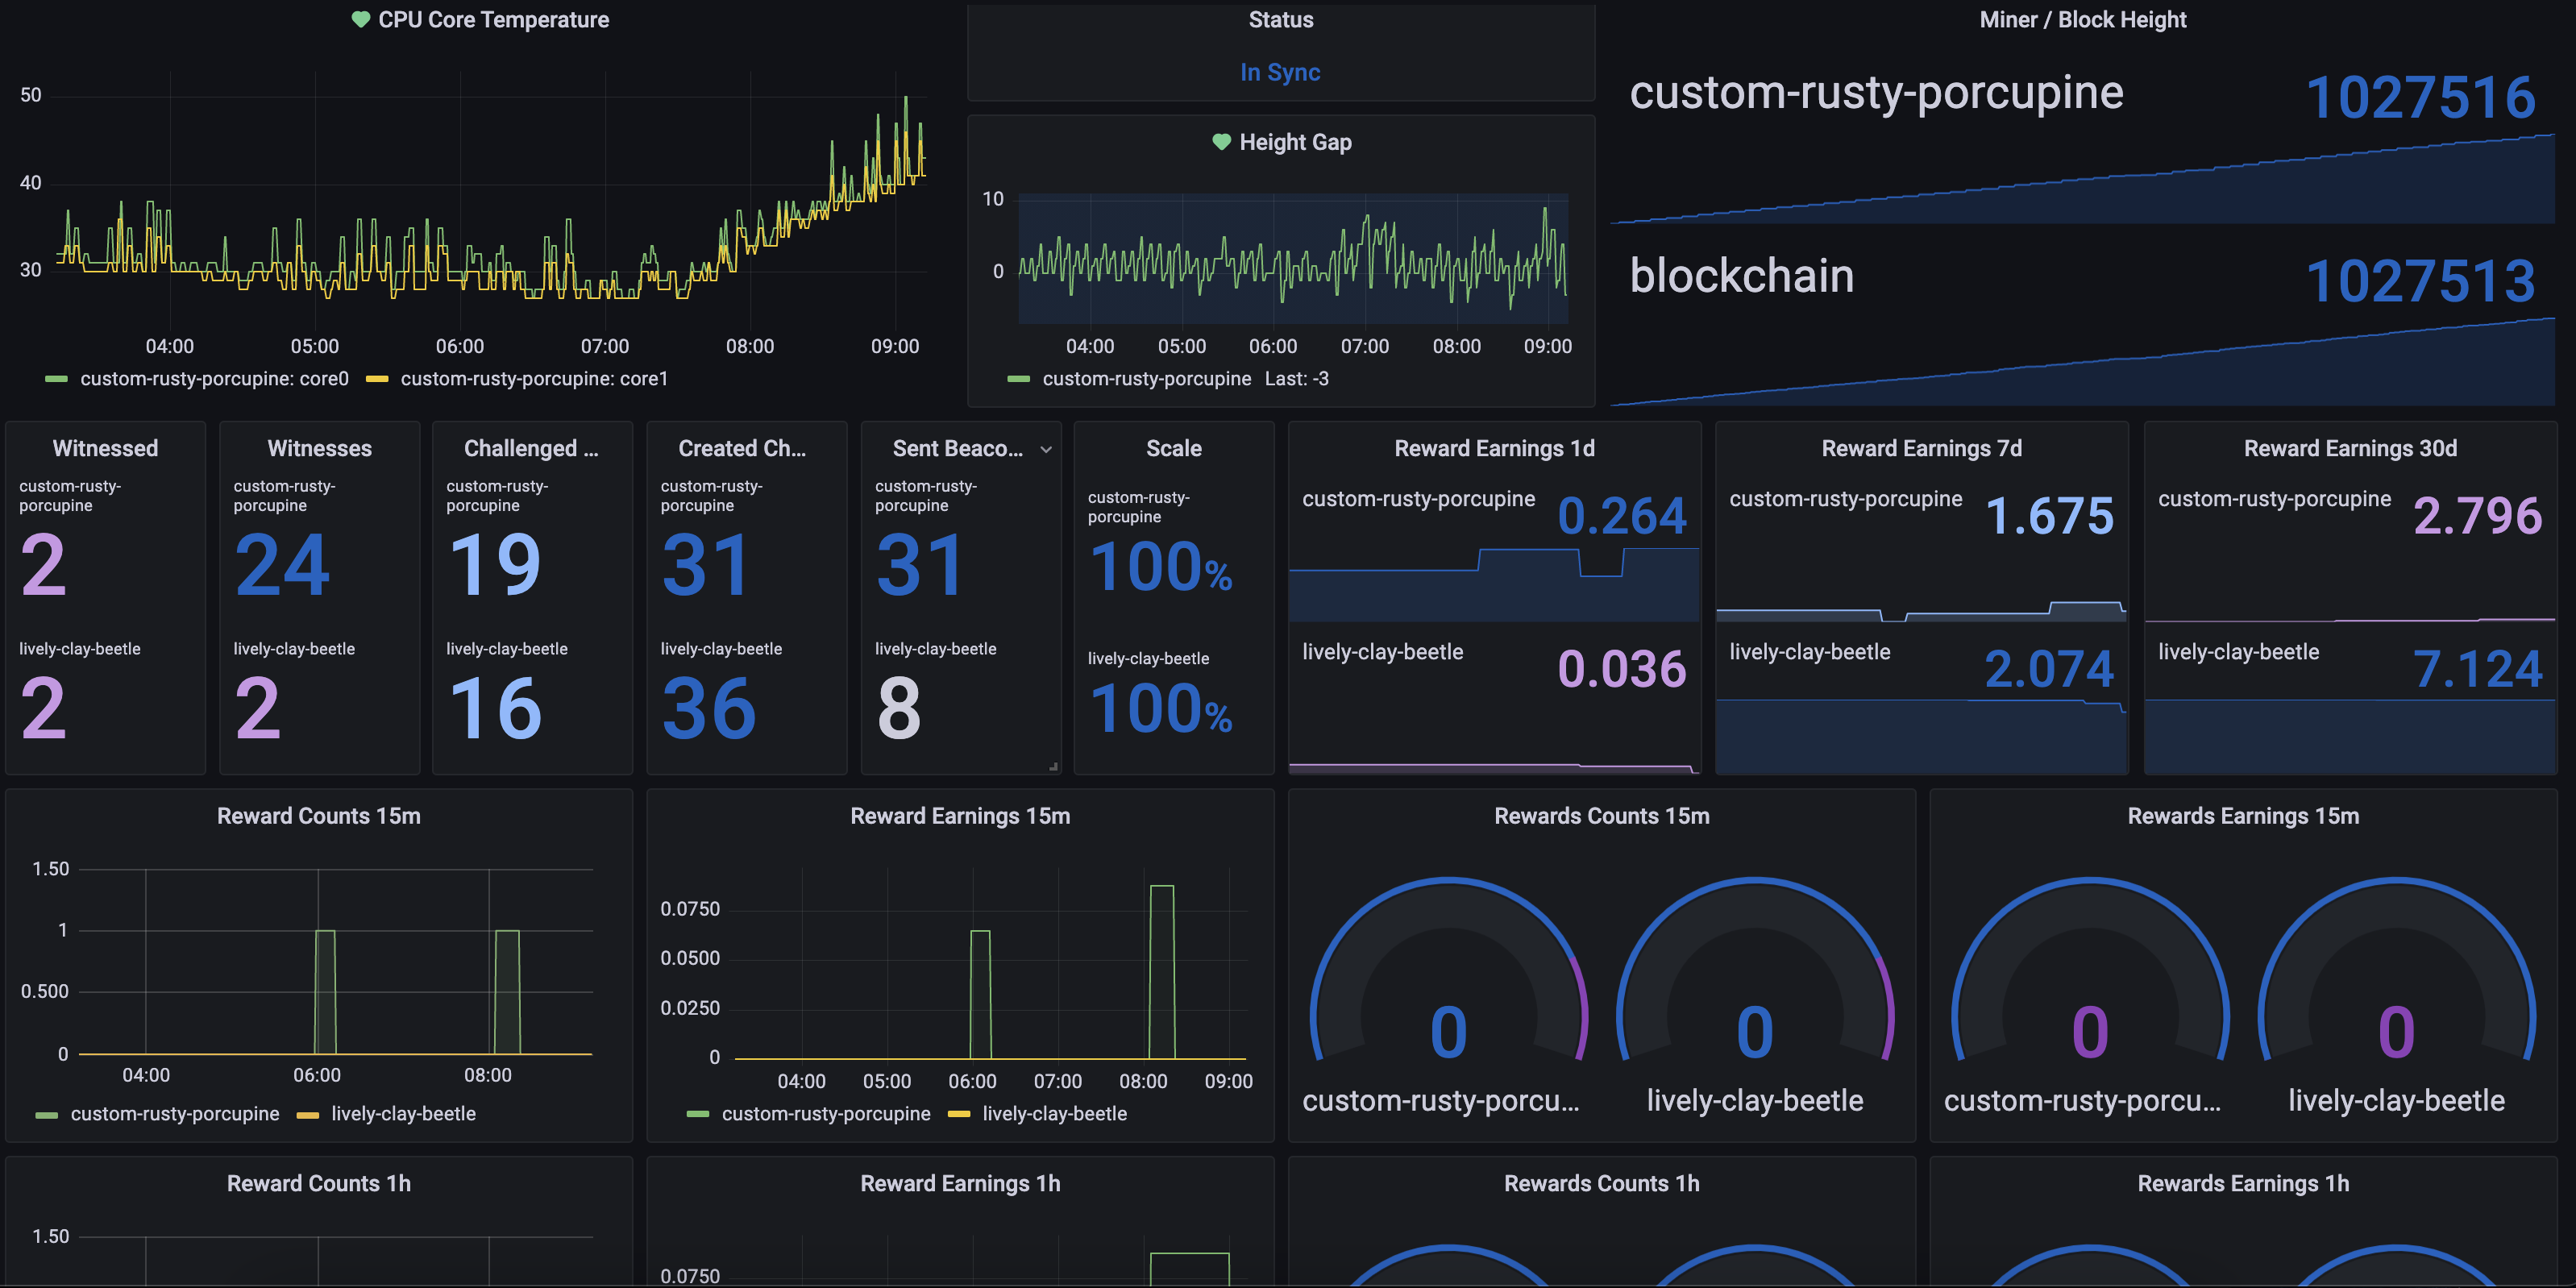
This repo is used to produce metrics from miner api's and the Helium blockchain. We can use the metrics to diagnose, alert, and prevent poor mining performance. Currently we extract the following metrics:
Hotspot API
- activity metrics
- block height
- reward counts (15 minute, 1 hour, 1 day, 7 days, 30 days)
- reward scale
- witnessed
- witnesses
Bobcat API
- block height
- cpu temperatures
- height gap
- miner height
- sync status
LongAP
- block height
- height gap
- miner connected
- miner height
- online status
- sync status
Nebra
- block height
- bluetooth connected
- frequency
- height gap
- lora status
- miner connected
- miner height
- relayed
- sync percent
- sync status
Sensecap API
- antenna gain
- block height
- cpu temperature
- cpu used
- dialable
- height gap
- is healthy
- memory total
- memory used
- nat type
- miner connected
- miner height
- relayed
- sd total
- sd used
- sync status
Minimum system resources to run this stack are. This will support 5 miners with decent activity
- CoreI5
- 6GB RAM
- 7200 RPM Disk
- x86 / x64 systems (no ARM support)
If you plan to not use docker to manage your metric collection, you will need to have your monitoring platform setup by using prometheus, prometheus push gateway, and grafana. The pushgateway, from prometheus, will allow us to push metrics to prometheus instead of trying to host the metrics ourselves on an http endpoint.
-
Prometheus
-
Grafana
-
JQ
You can install docker and docker-compose by running the hnt_monitor.sh script. This will install all of the dependencies necessary, walk you through a setup wizard, and deploy the service. With docker we can create the entire monitoring stack using docker-compose.
$> ./hnt_monitor.shIf you want to only install the dependencies and not setup and deploy, you can pass in the argument prereq to the hnt_monitor.sh script.
$> ./hnt_monitor.sh prereqYou will need to install docker and docker-compose manually. You can do that by installing docker desktop for windows.
The hnt_monitor.sh script will install the necessary software and walk you through setting up the monitor stack. Follow the prompts, input your miners, and let the script install the platform
$> ./hnt_monitor.shNavitage to the src/conf/ directory and add your miners hotspot address (the public address assigned to the miner on the blockchain "112nVe...") to the address.list file. Next, update the hnt_monitor.conf file with your prometheus push gateway host and port, <your_miner>_monitor=true, and supply your miners addresses. Then run the hnt monitor script manually in the src/bin directory. You can visit the host:port of the machine running prometheus pushgaeway and see the new metrics.
$> ./src/bin/hnt_monitorRun in the background if you want to make it a service
$> ./src/bin/hnt_monitor &NOTE
-
*_addresses=is always referring to the hotspot public address found on the blockchain and explorer. This is the long character string like112vGthen34DVHjnj... -
*_ips=is always referring to the hotspot private ip addresses that is assigned by your internal router.192.168.2.1 -
*_serial_numbersis always referring to the hotspot unique id identifier that your vendor has supplied
You can add multiple miners by quoting and separating with a space. "address1 address2 address3"
Run the hnt monitor script standalone
$> docker build -t hnt_monitor -f build/docker/Dockerfile .
$> docker run --rm -it hnt_monitor help     # help menu
$> docker run -d -e HNT_HOTSPOT_MONITOR=true -e HNT_HOTSPOT_ADDRESSES="12345..." -e HNT_PROMETHEUS_PG_HOST=http://my.prometheus-pushgateway.host:9091 hnt_monitor # Enable hotspot monitoring from helium apiRun the hnt_monitor.sh script to configure the docker-compose settings and launch the stack.
$> ./hnt_monitor.shEdit the hnt_monitor.yml file and add your miner information to the hnt_monitor service environment variables.
  hnt_monitor:
    container_name: hnt_monitor
    image: hnt_monitor:latest
    build:
      dockerfile: ./build/docker/Dockerfile
      context: .
    environment:
      DO_NOT_REMOVE: "setup"
      HNT_HOTSPOT_MONITOR: "true"
      HNT_HOTSPOT_ADDRESSES: "<myminersaddress> "   # Update your miner address on this line before launching the stack
      HNT_PROMETHEUS_PG_HOST: "http://prometheus_pushgateway:9091"
      HNT_DEBUG: "true"
    networks:
      hnt_monitor:
        ipv4_address: 10.30.0.05
    depends_on:
      - prometheus_pushgateway
Check the variables table below for more options that the hnt_monitor supports. Once you're satisfied, you can run the docker-compose, up command, below to launch the stack.
$> docker-compose -f hnt_monitor.yml up -d --build
Once docker-compose completes, you can verify the endpoints in your browser. Open your favorite web browser and check the following endpoints
| Application | Endpoint |
|---|---|
| grafana | http://localhost:3000 |
| prometheus | http://localhost:9090 |
| prometheus pushgateway | http://localhost:9091 |
Using the hnt_monitor.sh you can provide the update command to pull down the latest release and deploy. This will automatically reset any local changes you have made so be sure to copy your work to another directory if you have done your own development. You do not need to worry about the hnt_monitor.yml changess that exist. The hnt_monitor.sh script will use its own .yml file
$> ./hnt_monitor.sh updateIf you have to update manually there are a couple of things you need to do so you dont lose your settings. Make sure to do the following to update your version safely.
- Copy the existing
hnt_monitor.ymlto another directory - Git pull the repo down and checkout the release version or download and unzip the release
- Copy your
hnt_monitor.ymlto the new release - Then run
docker-compose -f hnt_monitor.yml up -d --build
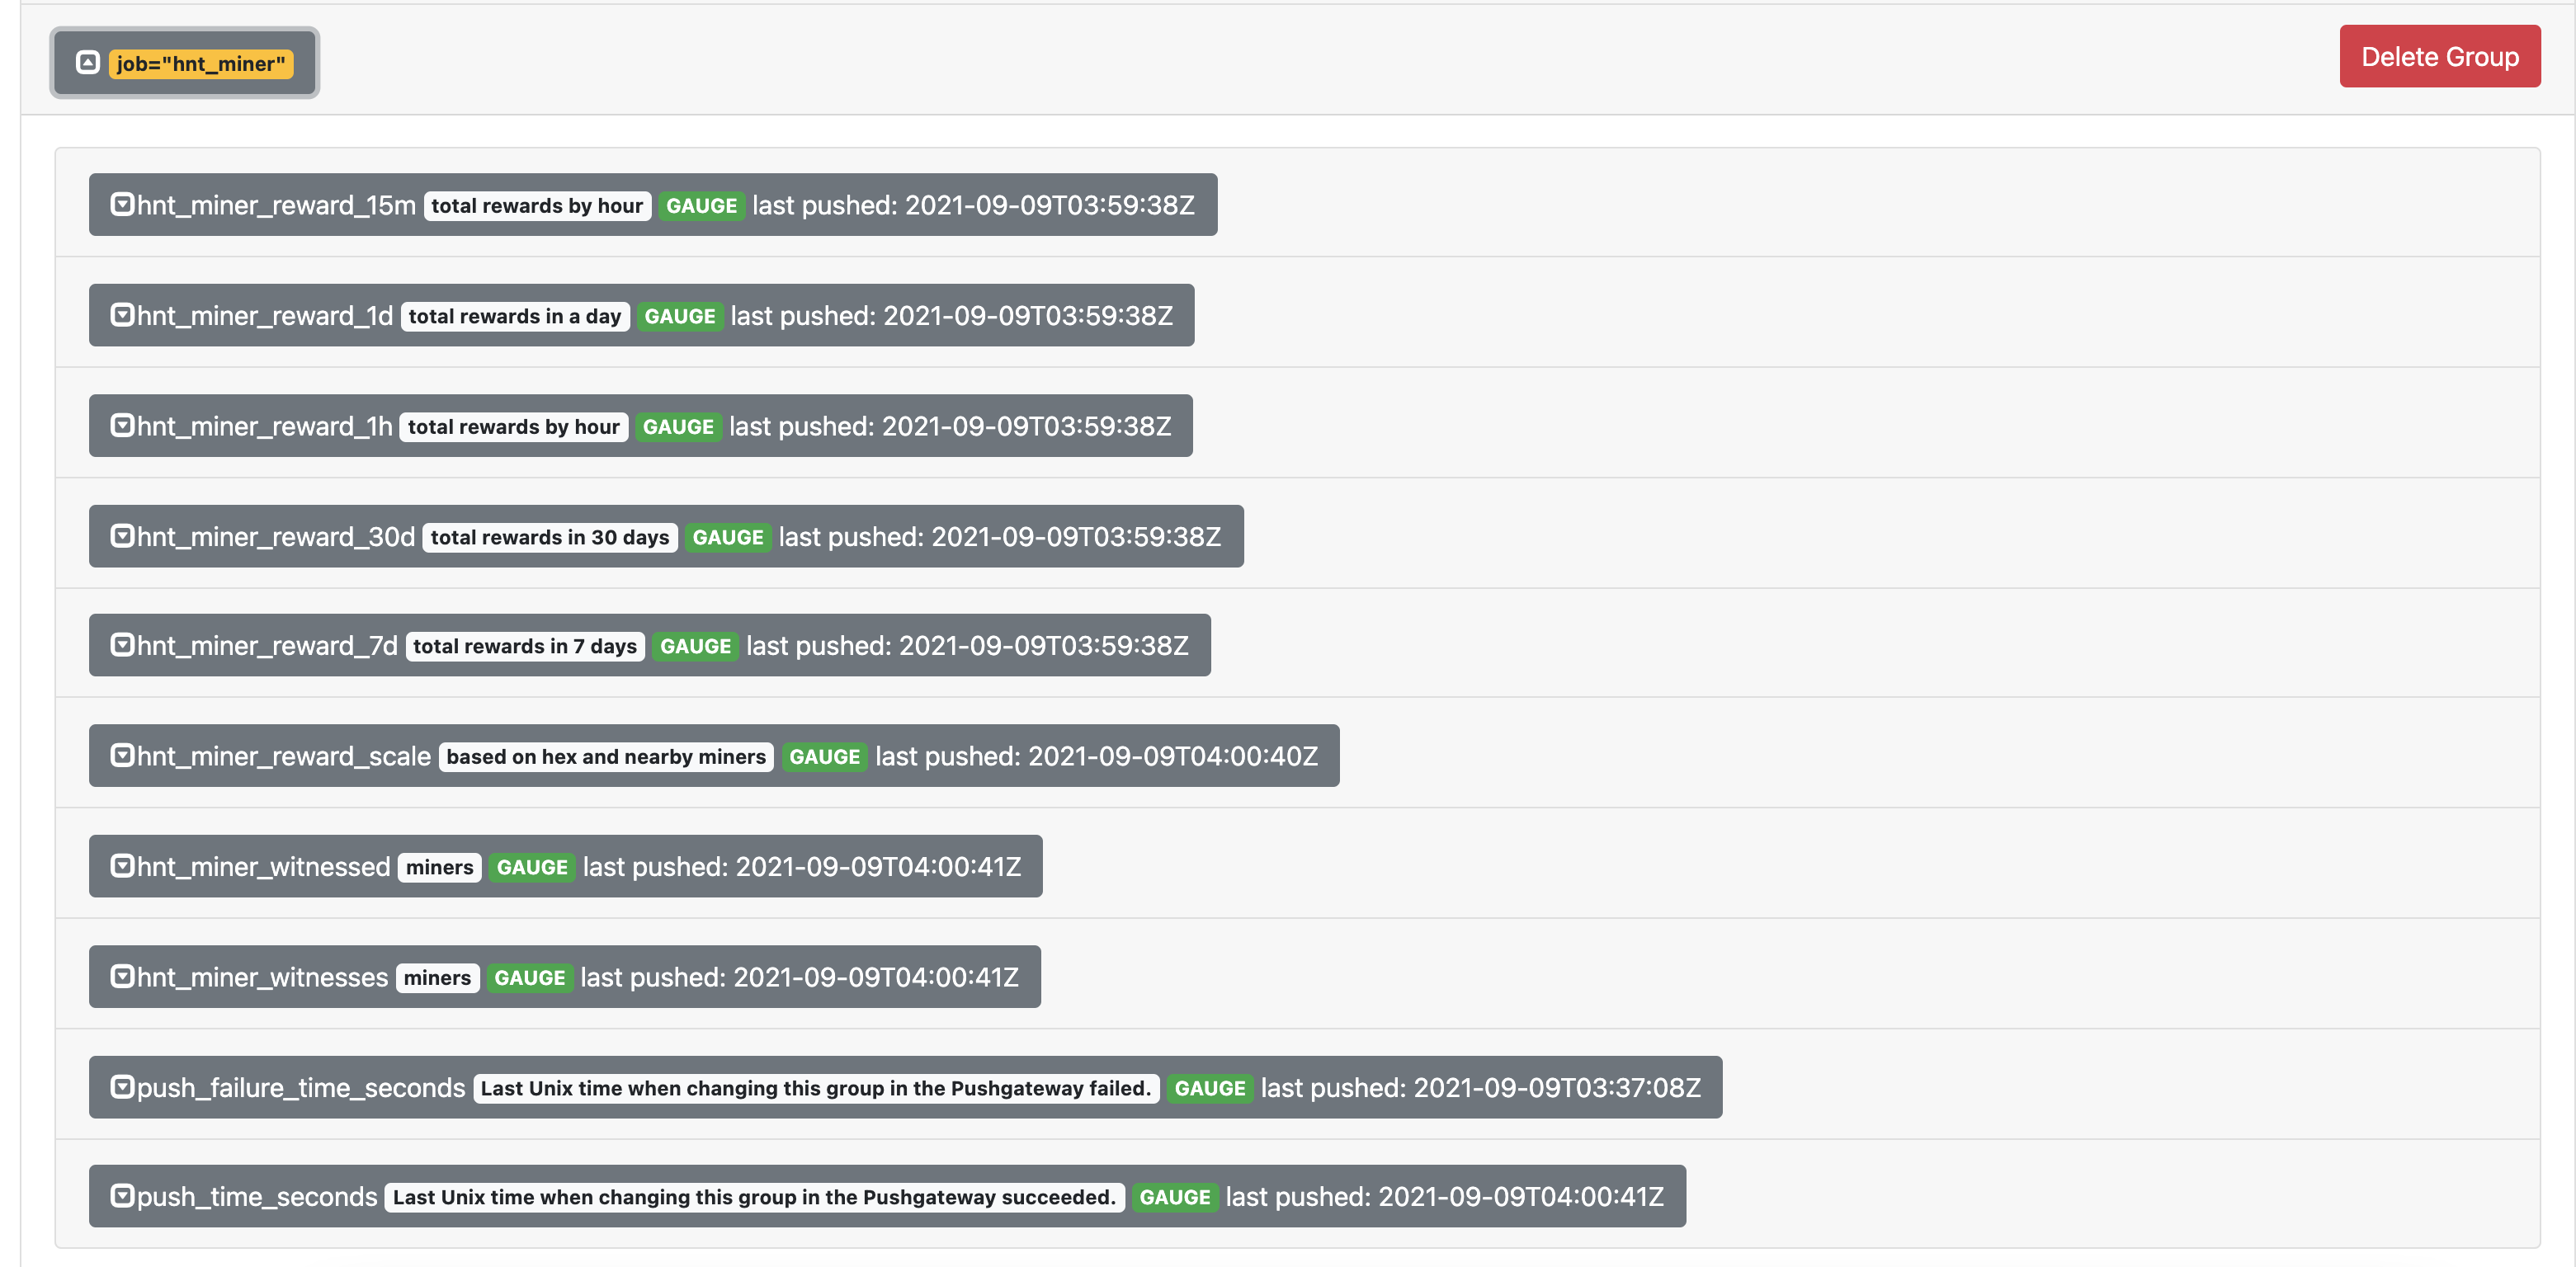
Check the prometheus push gateway to see metrics have been pushed from the hnt_monitor. This service is listening 9091, navigate to http://localhost:9091 in your browser. You should see a screen like below, with all of the available metrics from the miner collector.
NOTE
Initial etl processing takes up to 2 minutes to push data. Please allow time for the metrics to be pushed before verification.
$> docker logs -f hnt_monitor$> docker run -it --rm hnt_monitor help| Name | Default | Description | Required |
|---|---|---|---|
HNT_BLOCKS_URL |
api.helium.io/v1/blocks |
The helium blocks api url. | no |
HNT_BOBCAT_IPS |
If bobcat monitoring enabled, list of ips. Ex: '192.x.x.2 192.x.x.3 192.x.x.etc' | no |
|
HNT_BOBCAT_MONITOR |
false |
Enable or disable bobcat monitoring. Boolean: (true or false) |
no |
HNT_DEBUG |
false |
Turn on debug logging. Boolean: (true or false) |
no |
HNT_HELIUM_MONITOR |
true |
Enable or disable helium monitoring. Boolean: (true or false) |
no |
HNT_HOTSPOT_ADDRESSES |
Hotspot miner addresses to get metrics from. Ex: 'address1 address2 address3 etc' | no |
|
HNT_HOTSPOT_MONITOR |
false |
Enable hotspot monitoring from helium api. Boolean: (true or false) |
no |
HNT_HOTSPOT_URL |
api.helium.io/v1/hotspots |
The helium hotspot api url. | no |
HNT_LOGFILE |
stdout |
Send logs to this file | no |
HNT_LOGPATH |
/dev/ |
Send logs to this path | no |
HNT_LONGAP_ADDRESSES |
If longap monitoring enabled, list of ips. Ex: 'address1 address2 address3' | no |
|
HNT_LONGAP_MONITOR |
false |
Enable or disable bobcat monitoring. Boolean: (true or false) |
no |
HNT_NEBRA_IPS |
If nebra monitoring enabled, list of ips. Ex: '192.x.x.2 192.x.x.3 192.x.x.etc' | no |
|
HNT_NEBRA_MONITOR |
false |
Enable or disable nebra monitoring. Boolean: (true or false) |
no |
HNT_PROJECT |
hnt_monitor |
The name of the metric prefix when sending to prometheus. | no |
HNT_PROMETHEUS_PG_HOST |
http://localhost:9091 |
The prometheus push gateway hostname. | yes |
HNT_SENSECAP_API_KEY |
Api key for sensecap | no |
|
HNT_SENSECAP_MONITOR |
false |
Enable or disable sensecap monitoring. Boolean: (true or false) |
no |
HNT_SENSECAP_SERIAL_NUMBERS |
If sensecap monitoring enabled, list of Serial numbers of the sensecap miners | no |
|
HNT_TRACE |
false |
Turn on trace logging. Produces more logs than debug. Boolean: (true or false) |
no |
Always welcomed, never required =)
HNT: 13Vazr2mTQSbu2wBGAkqpaLvJQEdSv5aMd3qpdXFJSw2pfNpqC4


